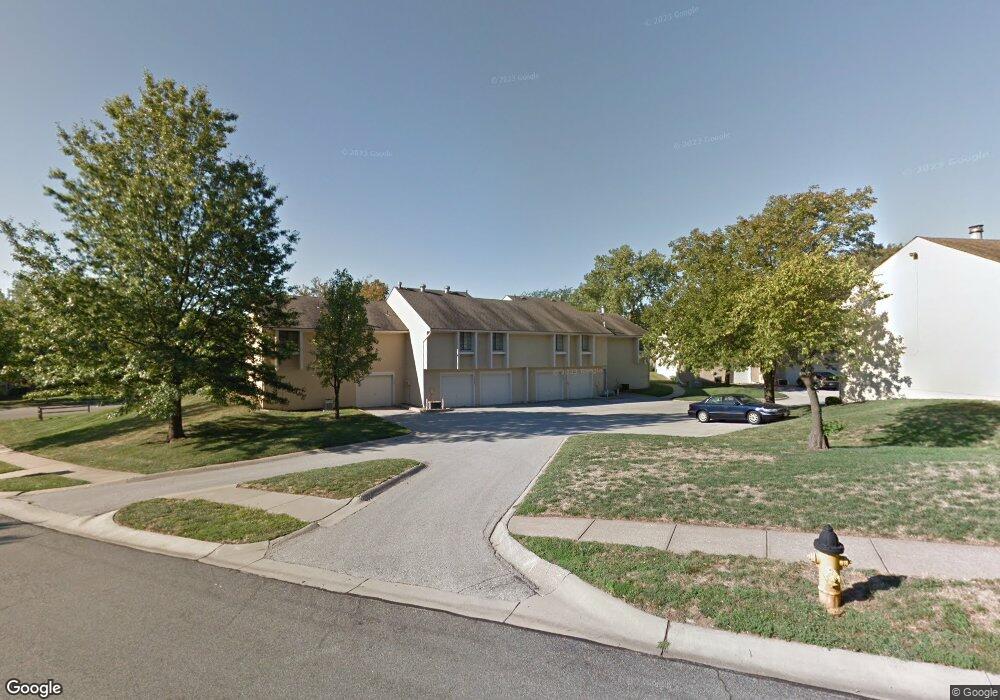
10804 Westgate Rd Overland Park, KS 66210
Central Overland Park NeighborhoodEstimated Value: $201,000 - $240,000
3
Beds
2
Baths
988
Sq Ft
$223/Sq Ft
Est. Value
About This Home
This home is located at 10804 Westgate Rd, Overland Park, KS 66210 and is currently estimated at $220,667, approximately $223 per square foot. 10804 Westgate Rd is a home located in Johnson County with nearby schools including Walnut Grove Elementary School, Pioneer Trail Middle School, and Olathe East Sr High School.
Ownership History
Date
Name
Owned For
Owner Type
Purchase Details
Closed on
Mar 2, 2016
Sold by
Riley Michael L and Riley Leah R
Bought by
Cannon Cindy M
Current Estimated Value
Purchase Details
Closed on
Aug 10, 2009
Sold by
Saidi Kambiez and Saidi Petra
Bought by
Riley Michael L and Ridley Leah R
Home Financials for this Owner
Home Financials are based on the most recent Mortgage that was taken out on this home.
Original Mortgage
$107,957
Interest Rate
5.26%
Mortgage Type
FHA
Purchase Details
Closed on
Oct 24, 2002
Sold by
Saidi Kambiez and Saidi Petra
Bought by
Saidi Kambiez and Saidi Petra
Home Financials for this Owner
Home Financials are based on the most recent Mortgage that was taken out on this home.
Original Mortgage
$97,850
Interest Rate
6.01%
Purchase Details
Closed on
Mar 8, 2001
Sold by
Kennedy Joan E
Bought by
Saidi Kambiez
Home Financials for this Owner
Home Financials are based on the most recent Mortgage that was taken out on this home.
Original Mortgage
$97,650
Interest Rate
6.95%
Create a Home Valuation Report for This Property
The Home Valuation Report is an in-depth analysis detailing your home's value as well as a comparison with similar homes in the area
Home Values in the Area
Average Home Value in this Area
Purchase History
| Date | Buyer | Sale Price | Title Company |
|---|---|---|---|
| Cannon Cindy M | -- | Kansas City Title | |
| Cannon Cindy M | -- | Kansas City Title | |
| Riley Michael L | -- | Chicago Title Ins Co | |
| Saidi Kambiez | -- | All American Title Company | |
| Saidi Kambiez | -- | Chicago Title Insurance Co |
Source: Public Records
Mortgage History
| Date | Status | Borrower | Loan Amount |
|---|---|---|---|
| Previous Owner | Riley Michael L | $107,957 | |
| Previous Owner | Saidi Kambiez | $97,850 | |
| Previous Owner | Saidi Kambiez | $97,650 |
Source: Public Records
Tax History Compared to Growth
Tax History
| Year | Tax Paid | Tax Assessment Tax Assessment Total Assessment is a certain percentage of the fair market value that is determined by local assessors to be the total taxable value of land and additions on the property. | Land | Improvement |
|---|---|---|---|---|
| 2024 | $2,130 | $20,286 | $3,542 | $16,744 |
| 2023 | $2,167 | $19,861 | $3,542 | $16,319 |
| 2022 | $2,017 | $18,113 | $2,956 | $15,157 |
| 2021 | $1,819 | $15,364 | $2,366 | $12,998 |
| 2020 | $1,727 | $14,594 | $2,366 | $12,228 |
| 2019 | $1,724 | $14,467 | $2,366 | $12,101 |
| 2018 | $1,628 | $13,559 | $2,151 | $11,408 |
| 2017 | $1,474 | $12,202 | $1,955 | $10,247 |
| 2016 | $1,475 | $12,512 | $1,955 | $10,557 |
| 2015 | $1,617 | $13,869 | $1,955 | $11,914 |
| 2013 | -- | $12,029 | $1,955 | $10,074 |
Source: Public Records
Map
Nearby Homes
- 12696 W 108th Terrace
- 10853 Rosehill Rd
- 10863 Rosehill Rd
- 12707 W 108th Terrace
- 10997 Rosehill Rd
- 12782 W 108th Terrace
- 10981 Rosehill Rd
- 12808 W 108th St
- 10901 Gillette St
- 12618 W 110th Terrace
- 10561 Long St
- 10909 Gillette St
- 10566 Century Ln
- 12641 W 110th Terrace
- 10951 Gillette St
- 12623 W 110th Terrace
- 12653 W 110th Terrace
- 12659 W 110th Terrace
- 10989 Gillette St
- 12400 W 105th Terrace
- 10804 Westgate Rd
- 10806 Westgate St
- 10806 Westgate Rd
- 10802 Westgate Rd
- 10800 Westgate Rd
- 12690 W 108th Terrace
- 12679 W 108th St
- 12692 W 108th Terrace
- 12681 W 108th St
- 12694 W 108th Terrace
- 12683 W 108th St
- 12685 W 108th St
- 12700 W 108th Terrace
- 12701 W 108th St
- 12632 W 108th St
- 12650 W 108th St
- 12702 W 108th Terrace
- 12634 W 108th St
- 12648 W 108th St
- 12703 W 108th St