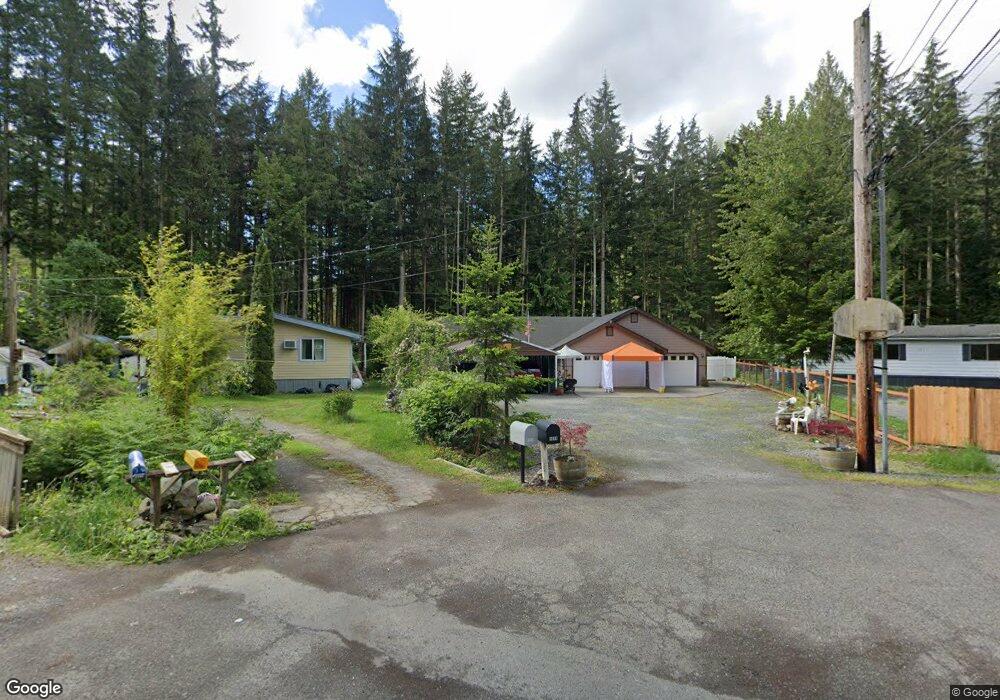
1081 Red Valley Ln Maple Falls, WA 98266
Estimated Value: $369,000 - $400,000
3
Beds
2
Baths
1,288
Sq Ft
$299/Sq Ft
Est. Value
About This Home
This home is located at 1081 Red Valley Ln, Maple Falls, WA 98266 and is currently estimated at $384,980, approximately $298 per square foot. 1081 Red Valley Ln is a home located in Whatcom County with nearby schools including Mount Baker Senior High School.
Ownership History
Date
Name
Owned For
Owner Type
Purchase Details
Closed on
May 17, 2022
Sold by
Tolar Technologies Llc
Bought by
Cc-Owatonna Mn Llc
Current Estimated Value
Purchase Details
Closed on
Apr 8, 2022
Sold by
Lucero Charles Darwin and Lucero Clara Luz
Bought by
Lucero Charles Darwin and Lucero Clara Luz
Purchase Details
Closed on
May 13, 2005
Sold by
Levien Jerry and Magee Amy
Bought by
Lucero Charles D and Lucero Clara L
Home Financials for this Owner
Home Financials are based on the most recent Mortgage that was taken out on this home.
Original Mortgage
$123,000
Interest Rate
5.87%
Mortgage Type
Fannie Mae Freddie Mac
Purchase Details
Closed on
Apr 19, 2004
Sold by
Collins Thomas R
Bought by
Levien Jerry and Magee Amy
Purchase Details
Closed on
Jul 30, 1999
Sold by
Sorbo Daryl J and Sorbo Nicole
Bought by
Collins Thomas R
Purchase Details
Closed on
Apr 28, 1999
Sold by
Starmark Funding Llc
Bought by
Sorbo Daryl and Sorbo Nicole
Create a Home Valuation Report for This Property
The Home Valuation Report is an in-depth analysis detailing your home's value as well as a comparison with similar homes in the area
Home Values in the Area
Average Home Value in this Area
Purchase History
| Date | Buyer | Sale Price | Title Company |
|---|---|---|---|
| Cc-Owatonna Mn Llc | -- | First American Title | |
| Lucero Charles Darwin | -- | None Listed On Document | |
| Lucero Charles D | $159,000 | Whatcom Land Title | |
| Levien Jerry | $8,000 | First American Title Insuran | |
| Collins Thomas R | $28,942 | First American Title Ins | |
| Sorbo Daryl | -- | First American Title Ins Co |
Source: Public Records
Mortgage History
| Date | Status | Borrower | Loan Amount |
|---|---|---|---|
| Previous Owner | Lucero Charles D | $123,000 |
Source: Public Records
Tax History Compared to Growth
Tax History
| Year | Tax Paid | Tax Assessment Tax Assessment Total Assessment is a certain percentage of the fair market value that is determined by local assessors to be the total taxable value of land and additions on the property. | Land | Improvement |
|---|---|---|---|---|
| 2024 | $403 | $340,387 | $90,000 | $250,387 |
| 2023 | $403 | $344,056 | $68,808 | $275,248 |
| 2022 | $772 | $275,248 | $55,047 | $112,273 |
| 2021 | $845 | $218,455 | $43,689 | $112,273 |
| 2020 | $874 | $172,013 | $34,401 | $137,612 |
| 2019 | $917 | $172,013 | $34,401 | $137,612 |
| 2018 | $1,716 | $150,007 | $30,000 | $120,007 |
| 2017 | $1,449 | $136,927 | $24,654 | $112,273 |
| 2016 | $1,400 | $123,556 | $22,260 | $101,296 |
| 2015 | $1,310 | $118,505 | $21,735 | $96,770 |
| 2014 | -- | $111,459 | $20,370 | $91,089 |
| 2013 | -- | $117,289 | $21,000 | $96,289 |
Source: Public Records
Map
Nearby Homes
- 901 Ruby Valley Ct
- 846 Deep Valley Dr
- 8256 Gold Run Dr
- 6360 Blackfoot Place
- 3001 Green Valley Dr
- 6511 Watson Loop
- 6360 Overland Trail
- 8397 Golden Valley Blvd
- 8363 Holly Ln
- 6331 Overland Trail
- 8390 Dolphin Way
- 8095 Mosey Ct
- 6257 Azure Way
- 8147 Peaceful Valley Ct
- 172 Sprague Valley Dr
- 8151 Peaceful Valley Ct
- 6240 Azure Way
- 6284 Lariat Place
- 8410 Cimarron Way
- 8452 Aspen Ct
- 1071 Red Valley Ct
- 1061 Red Valley Ln
- 1541 Frontier Valley Ln
- 1531 Frontier Valley Ln
- 1051 Red Valley Ln
- 1571 Frontier Valley Ln
- 1151 Hopeful Valley Ln
- 1111 Deep Valley Dr
- 1101 Red Valley Ct
- 1051 Red Valley Ct
- 1141 Hopeful Valley Ln
- 1521 Frontier Valley Ln
- 1161 Hopeful Valley Ln
- 1721 Peaceful Valley Dr
- 1861 Peaceful Valley Dr
- 1511 Frontier Valley Ln
- 1711 Peaceful Valley Dr
- 1591 Frontier Valley Ln
- 1131 Hopeful Valley Ln
- 1121 Deep Valley Dr