Estimated Value: $220,000 - $254,000
3
Beds
2
Baths
1,224
Sq Ft
$190/Sq Ft
Est. Value
About This Home
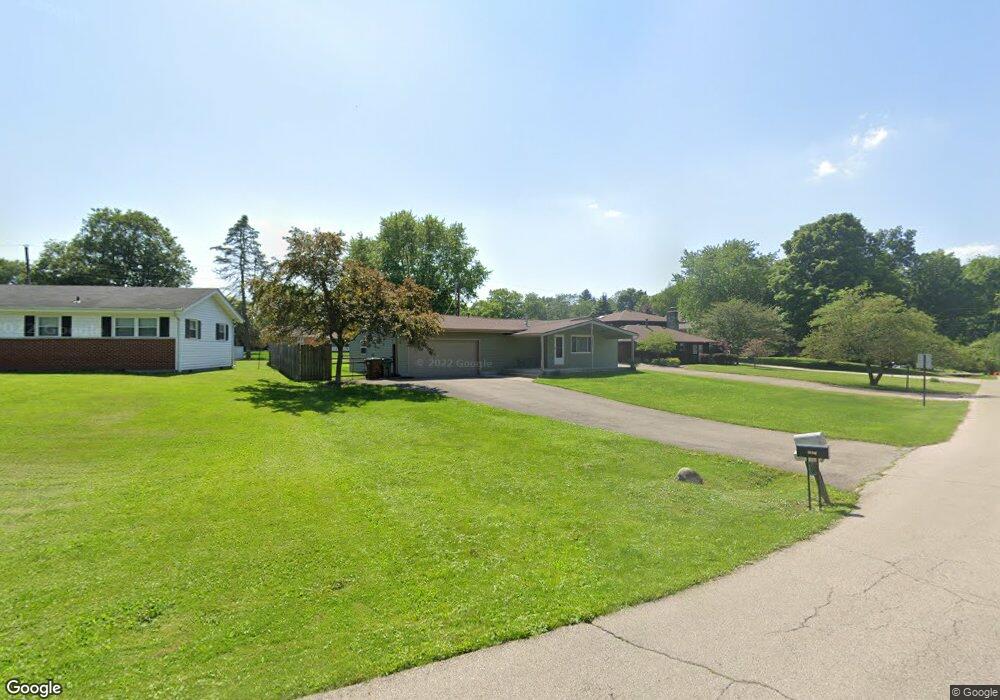
This home is located at 1081 Yellowstone Rd, Xenia, OH 45385 and is currently estimated at $232,911, approximately $190 per square foot. 1081 Yellowstone Rd is a home located in Greene County with nearby schools including Xenia High School, Summit Academy Community School for Alternative Learners - Xenia, and Legacy Christian Academy.
Ownership History
Date
Name
Owned For
Owner Type
Purchase Details
Closed on
Jul 10, 2020
Sold by
Marshall Edythe S
Bought by
Shaw Emily S and Shaw Casey
Current Estimated Value
Home Financials for this Owner
Home Financials are based on the most recent Mortgage that was taken out on this home.
Original Mortgage
$126,100
Outstanding Balance
$112,025
Interest Rate
3.2%
Mortgage Type
New Conventional
Estimated Equity
$120,886
Purchase Details
Closed on
Feb 25, 2016
Bought by
Marshall Edythe S
Purchase Details
Closed on
Aug 17, 1998
Sold by
Rohrback David B and Rohrback Debra L
Bought by
Marshall Kenneth D and Marshall Edythe S
Home Financials for this Owner
Home Financials are based on the most recent Mortgage that was taken out on this home.
Original Mortgage
$83,100
Interest Rate
6.99%
Create a Home Valuation Report for This Property
The Home Valuation Report is an in-depth analysis detailing your home's value as well as a comparison with similar homes in the area
Home Values in the Area
Average Home Value in this Area
Purchase History
| Date | Buyer | Sale Price | Title Company |
|---|---|---|---|
| Shaw Emily S | -- | None Available | |
| Marshall Edythe S | -- | -- | |
| Marshall Kenneth D | $87,500 | -- |
Source: Public Records
Mortgage History
| Date | Status | Borrower | Loan Amount |
|---|---|---|---|
| Open | Shaw Emily S | $126,100 | |
| Previous Owner | Marshall Kenneth D | $83,100 |
Source: Public Records
Tax History Compared to Growth
Tax History
| Year | Tax Paid | Tax Assessment Tax Assessment Total Assessment is a certain percentage of the fair market value that is determined by local assessors to be the total taxable value of land and additions on the property. | Land | Improvement |
|---|---|---|---|---|
| 2024 | $2,780 | $57,200 | $13,940 | $43,260 |
| 2023 | $2,780 | $57,200 | $13,940 | $43,260 |
| 2022 | $2,314 | $43,150 | $11,620 | $31,530 |
| 2021 | $2,343 | $43,150 | $11,620 | $31,530 |
| 2020 | $2,252 | $43,150 | $11,620 | $31,530 |
| 2019 | $1,860 | $33,460 | $10,280 | $23,180 |
| 2018 | $1,867 | $33,460 | $10,280 | $23,180 |
| 2017 | $1,817 | $33,460 | $10,280 | $23,180 |
| 2016 | $1,756 | $31,800 | $10,280 | $21,520 |
| 2015 | $1,761 | $31,800 | $10,280 | $21,520 |
| 2014 | $1,689 | $31,800 | $10,280 | $21,520 |
Source: Public Records
Map
Nearby Homes
- 15 Sexton Dr
- 965 Oak Dale Dr
- 2018 Tahoe Dr
- 2537 Ridge Rd
- 2094 Malibu Trail
- 460 Kinsey Rd
- 1359 Eagles Way
- 1968 El Camino Dr
- 1311 Eagles Way
- 1872 Harris Ln
- 983 Echo Ct
- 1815 Promenade Ln
- 493 Hollywood Blvd
- 499 Hollywood Blvd
- 1171 N Detroit St
- 1791 Palmer Ct
- 1038 Frederick Dr
- 1820 Palmer Ct
- 1814 Palmer Ct
- 1808 Palmer Ct
- 1073 Yellowstone Rd
- 1096 Yellowstone Rd
- 1071 Yellowstone Rd
- 113 Outerview Dr
- 1070 Trianon Dr
- 130 Outerview Dr
- 163 Outerview Dr
- 1061 Yellowstone Rd
- 1086 Whitestone Rd
- 142 Outerview Dr
- 1062 Trianon Dr
- 120 Outerview Dr
- 150 Outerview Dr
- 1062 Yellowstone Rd
- 1075 Trianon Dr
- 173 Outerview Dr
- 93 Outerview Dr
- 1071 Whitestone Rd
- 1051 Yellowstone Rd
- 1082 Whitestone Rd