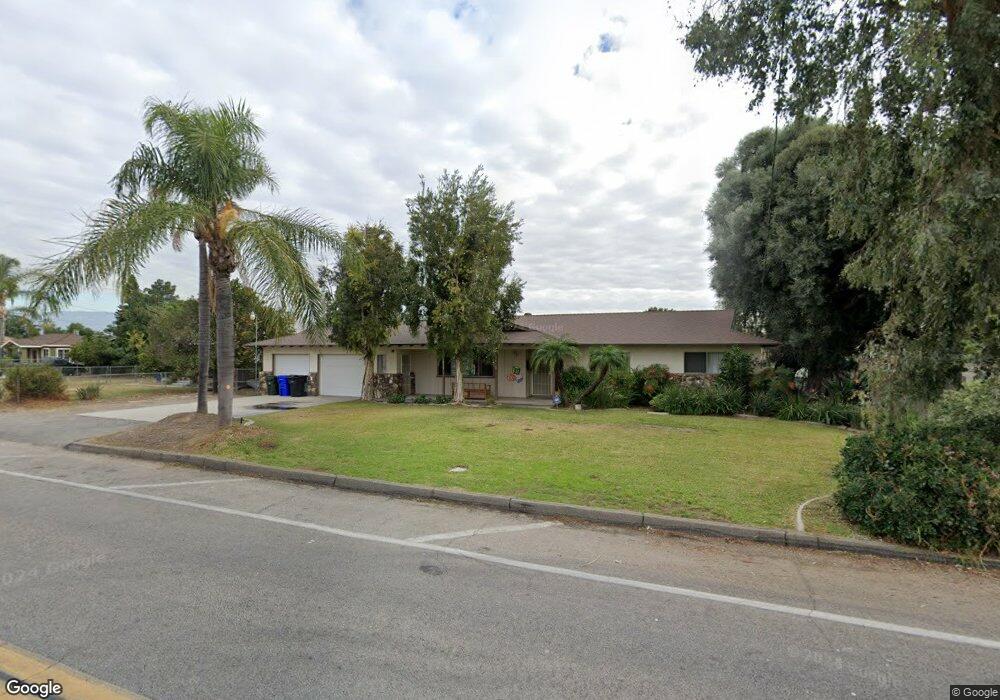
10813 Larch Ave Bloomington, CA 92316
Estimated Value: $605,000 - $668,184
3
Beds
2
Baths
1,621
Sq Ft
$394/Sq Ft
Est. Value
About This Home
This home is located at 10813 Larch Ave, Bloomington, CA 92316 and is currently estimated at $639,046, approximately $394 per square foot. 10813 Larch Ave is a home located in San Bernardino County with nearby schools including Crestmore Elementary School, Joe Baca, and Bloomington High School.
Ownership History
Date
Name
Owned For
Owner Type
Purchase Details
Closed on
Oct 31, 2024
Sold by
Off Cedar Llc
Bought by
Aoa Capital Investments
Current Estimated Value
Purchase Details
Closed on
Mar 4, 2022
Sold by
Lundgren Kenneth M and Lundgren Cindy
Bought by
Off Cedar Llc
Purchase Details
Closed on
Oct 23, 2020
Sold by
Lundgren Kenneth
Bought by
Lundgren Kenneth M and Lundgren Cindy
Home Financials for this Owner
Home Financials are based on the most recent Mortgage that was taken out on this home.
Original Mortgage
$256,750
Interest Rate
2.8%
Mortgage Type
Credit Line Revolving
Purchase Details
Closed on
Nov 19, 2010
Sold by
Lundgren Cindy J
Bought by
Lundgren Kenneth
Home Financials for this Owner
Home Financials are based on the most recent Mortgage that was taken out on this home.
Original Mortgage
$144,000
Interest Rate
4.17%
Mortgage Type
New Conventional
Purchase Details
Closed on
Mar 20, 2002
Sold by
Maurer Richard and Maurer Elizabeth
Bought by
Lundgren Kenneth
Home Financials for this Owner
Home Financials are based on the most recent Mortgage that was taken out on this home.
Original Mortgage
$157,426
Interest Rate
7.08%
Mortgage Type
FHA
Create a Home Valuation Report for This Property
The Home Valuation Report is an in-depth analysis detailing your home's value as well as a comparison with similar homes in the area
Home Values in the Area
Average Home Value in this Area
Purchase History
| Date | Buyer | Sale Price | Title Company |
|---|---|---|---|
| Aoa Capital Investments | $600,000 | Chicago Title | |
| Aoa Capital Investments | $600,000 | Chicago Title | |
| Off Cedar Llc | -- | Cimino Diana | |
| Lundgren Kenneth M | -- | California Members Title Co | |
| Lundgren Kenneth | -- | Advantage Title Inc | |
| Lundgren Kenneth | $160,000 | Old Republic Title Company |
Source: Public Records
Mortgage History
| Date | Status | Borrower | Loan Amount |
|---|---|---|---|
| Previous Owner | Lundgren Kenneth M | $256,750 | |
| Previous Owner | Lundgren Kenneth | $144,000 | |
| Previous Owner | Lundgren Kenneth | $157,426 |
Source: Public Records
Tax History
| Year | Tax Paid | Tax Assessment Tax Assessment Total Assessment is a certain percentage of the fair market value that is determined by local assessors to be the total taxable value of land and additions on the property. | Land | Improvement |
|---|---|---|---|---|
| 2025 | $7,634 | $600,000 | $150,000 | $450,000 |
| 2024 | $2,983 | $231,735 | $57,934 | $173,801 |
| 2023 | $6,853 | $227,191 | $56,798 | $170,393 |
| 2022 | $2,941 | $222,735 | $55,684 | $167,051 |
| 2021 | $2,993 | $218,367 | $54,592 | $163,775 |
| 2020 | $2,909 | $216,128 | $54,032 | $162,096 |
| 2019 | $2,833 | $211,891 | $52,973 | $158,918 |
| 2018 | $2,630 | $207,736 | $51,934 | $155,802 |
| 2017 | $2,536 | $203,663 | $50,916 | $152,747 |
| 2016 | $2,598 | $199,670 | $49,918 | $149,752 |
| 2015 | $2,514 | $196,671 | $49,168 | $147,503 |
| 2014 | $2,420 | $192,819 | $48,205 | $144,614 |
Source: Public Records
Map
Nearby Homes
- 10803 Larch Ave
- 10701 Larch Ave
- 10701 Cedar Ave Unit SPC 145
- 10701 Cedar Ave Unit 46
- 10701 Cedar Ave Unit 172
- 10701 Cedar Ave Unit 13
- 10701 Cedar Ave Unit 112
- 10701 Cedar Ave Unit 115
- 10573 Larch Ave
- 0 Argus Township Unit EV22013249
- 19182 Ash St
- 18490 Santa Ana
- 10517 Dream St
- 11048 Cactus Ave
- 10555 Elm Ave
- 10531 Elm St
- 18631 14th St
- 18264 Santa Ana Ave
- 19340 Jurupa Ave
- 11368 Cactus Ave
- 10828 Windy Ct
- 10835 Larch Ave
- 10795 Larch Ave
- 10840 Windy Ct
- 10824 Windy Ct
- 10849 Larch Ave
- 10818 Larch Ave
- 10834 Larch Ave
- 10793 Larch Ave
- 18915 Geronimo Ln
- 10854 Windy Ct
- 10827 Windy Ct
- 10839 Windy Ct
- 18925 Geronimo Ln
- 10865 Larch Ave
- 10866 Larch Ave
- 10853 Windy Ct
- 10870 Windy Ct
- 10831 Olive St
- 10811 Olive St
Your Personal Tour Guide
Ask me questions while you tour the home.