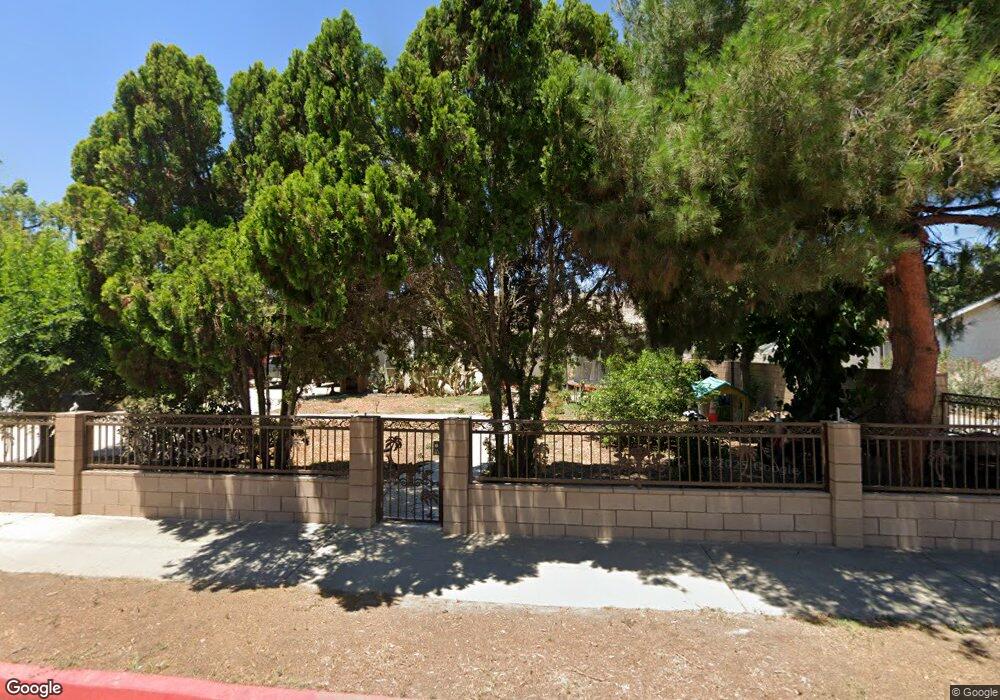
10815 Brockway Ave El Monte, CA 91731
Downtown El Monte NeighborhoodEstimated Value: $597,000 - $927,000
2
Beds
1
Bath
1,307
Sq Ft
$568/Sq Ft
Est. Value
About This Home
This home is located at 10815 Brockway Ave, El Monte, CA 91731 and is currently estimated at $742,333, approximately $567 per square foot. 10815 Brockway Ave is a home located in Los Angeles County with nearby schools including Columbia School, El Monte High School, and New Life Christian School.
Ownership History
Date
Name
Owned For
Owner Type
Purchase Details
Closed on
Apr 7, 2022
Sold by
Sandoval Henry Alexander and Sandoval Zasha Maite
Bought by
Arreaga Enrique Alejandro Sa and Robles Geronima Mayda
Current Estimated Value
Purchase Details
Closed on
May 20, 2011
Sold by
Le Vu Jolie D
Bought by
Vanle Ba Van and Le Thi Diep
Purchase Details
Closed on
May 1, 2007
Sold by
Le Son D and Le Tien Diep
Bought by
Le Vu Jolie D
Home Financials for this Owner
Home Financials are based on the most recent Mortgage that was taken out on this home.
Original Mortgage
$160,000
Interest Rate
6.16%
Mortgage Type
Purchase Money Mortgage
Purchase Details
Closed on
Aug 10, 2006
Sold by
Le Tien Diep
Bought by
Le Vu Jolie D
Purchase Details
Closed on
Nov 5, 1999
Sold by
Tien Diep Le
Bought by
Le Son D
Purchase Details
Closed on
Aug 18, 1997
Sold by
Le Tien D and Vanle Ba Van
Bought by
Le Tien Diep
Purchase Details
Closed on
Aug 16, 1995
Sold by
Le Tien Diep
Bought by
Vanle Ba Van and Le Thi Diep
Create a Home Valuation Report for This Property
The Home Valuation Report is an in-depth analysis detailing your home's value as well as a comparison with similar homes in the area
Home Values in the Area
Average Home Value in this Area
Purchase History
| Date | Buyer | Sale Price | Title Company |
|---|---|---|---|
| Arreaga Enrique Alejandro Sa | -- | Zambrano Omar | |
| Vanle Ba Van | $172,000 | None Available | |
| Le Vu Jolie D | -- | Southland Title | |
| Le Son D | -- | Southland Title | |
| Le Tien Diep | -- | Southland Title | |
| Le Vu Jolie D | -- | None Available | |
| Le Tien Diep | -- | None Available | |
| Le Son D | -- | Southland Title Corporation | |
| Le Tien Diep | -- | -- | |
| Vanle Ba Van | -- | -- |
Source: Public Records
Mortgage History
| Date | Status | Borrower | Loan Amount |
|---|---|---|---|
| Previous Owner | Le Vu Jolie D | $160,000 |
Source: Public Records
Tax History Compared to Growth
Tax History
| Year | Tax Paid | Tax Assessment Tax Assessment Total Assessment is a certain percentage of the fair market value that is determined by local assessors to be the total taxable value of land and additions on the property. | Land | Improvement |
|---|---|---|---|---|
| 2025 | $9,494 | $696,002 | $557,452 | $138,550 |
| 2024 | $9,494 | $682,356 | $546,522 | $135,834 |
| 2023 | $9,305 | $668,977 | $535,806 | $133,171 |
| 2022 | $8,867 | $655,860 | $525,300 | $130,560 |
| 2021 | $6,055 | $414,257 | $290,097 | $124,160 |
| 2020 | $6,038 | $410,010 | $287,123 | $122,887 |
| 2019 | $6,176 | $401,972 | $281,494 | $120,478 |
| 2018 | $6,034 | $394,091 | $275,975 | $118,116 |
| 2016 | $5,792 | $378,789 | $265,259 | $113,530 |
| 2015 | $5,727 | $373,100 | $261,275 | $111,825 |
| 2014 | $5,508 | $365,792 | $256,157 | $109,635 |
Source: Public Records
Map
Nearby Homes
- 3223 Washington Ave
- 3315 California Ave
- 10631 Mildred St
- 3154 Washington Ave
- 10521 Asher St
- 3544 Granada Ave
- 3051 Nevada Ave
- PLAN THREE at Brookhaven
- PLAN TWO at Brookhaven
- PLAN ONE at Brookhaven
- 3141 Santa Anita Ave E Unit C
- 3141 Santa Anita Ave E Unit A
- 3141 Santa Anita Ave E Unit F
- 3141 Santa Anita Ave E Unit E
- 3141 Santa Anita Ave E Unit D
- 3141 Santa Anita Ave E Unit B
- 10507 Bodger St
- 3361 Meeker Ave
- 2822 Gage Ave
- 2802 Granada Ave
- 3328 Lexington Ave
- 10819 Brockway Ave
- 3334 Lexington Ave
- 10825 Brockway Ave
- 3325 Washington Ave
- 3338 Lexington Ave
- 3327 Washington Ave
- 3323 Lexington Ave
- 3333 Washington Ave
- 10829 Brockway Ave
- 3327 Lexington Ave
- 3344 Lexington Ave
- 3333 Lexington Ave
- 3337 Washington Ave
- 3337 Lexington Ave
- 3348 Lexington Ave
- 3343 Washington Ave
- 3343 Lexington Ave
- 3347 Washington Ave
- 3354 Lexington Ave