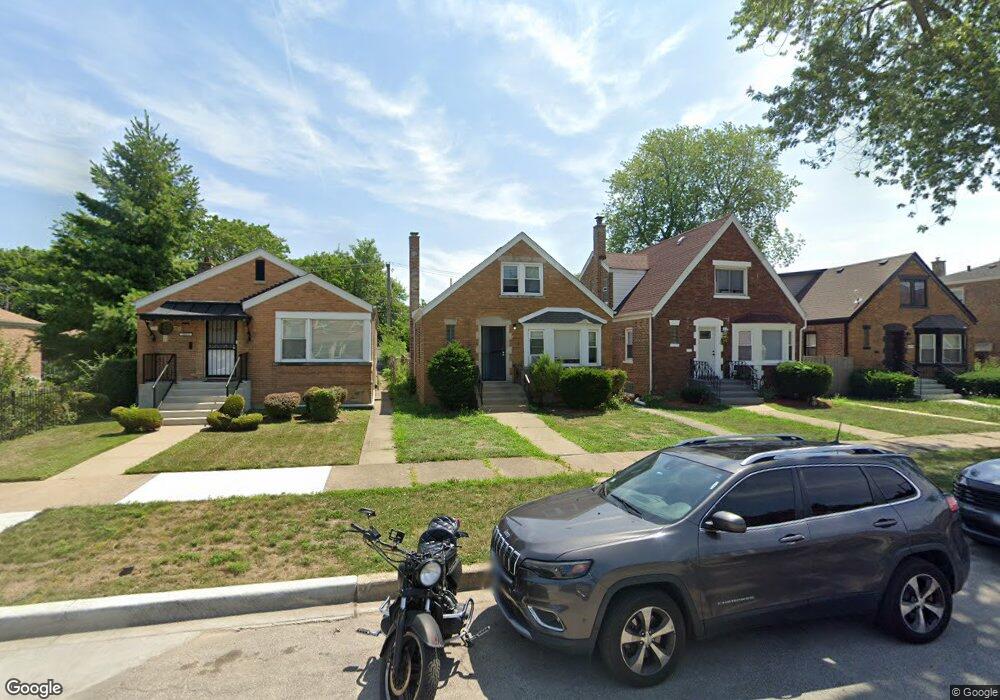
10815 S Eberhart Ave Chicago, IL 60628
Roseland NeighborhoodEstimated Value: $184,000 - $312,000
3
Beds
1
Bath
1,212
Sq Ft
$191/Sq Ft
Est. Value
About This Home
This home is located at 10815 S Eberhart Ave, Chicago, IL 60628 and is currently estimated at $231,588, approximately $191 per square foot. 10815 S Eberhart Ave is a home located in Cook County with nearby schools including Countee Cullen Elementary School, Corliss High School, and St. John de la Salle School.
Ownership History
Date
Name
Owned For
Owner Type
Purchase Details
Closed on
Sep 18, 2014
Sold by
Peirce
Bought by
Triple M Mazel Llc
Current Estimated Value
Purchase Details
Closed on
Jun 28, 2000
Sold by
First Midwest Trust Company Natl Assn
Bought by
Pierce Jerry and Pierce Kimberly
Home Financials for this Owner
Home Financials are based on the most recent Mortgage that was taken out on this home.
Original Mortgage
$97,342
Interest Rate
8.31%
Mortgage Type
FHA
Purchase Details
Closed on
Jan 27, 2000
Sold by
Bankers Trust Company Of California Na
Bought by
First Midwest Trust Company and Trust #89-3666
Purchase Details
Closed on
Dec 18, 1996
Sold by
Nathaniel Vaya C
Bought by
Nathaniel Dwayne T
Home Financials for this Owner
Home Financials are based on the most recent Mortgage that was taken out on this home.
Original Mortgage
$69,700
Interest Rate
7.6%
Purchase Details
Closed on
Oct 17, 1996
Sold by
Nathaniel Dwayne T
Bought by
Nathaniel Herbert W
Create a Home Valuation Report for This Property
The Home Valuation Report is an in-depth analysis detailing your home's value as well as a comparison with similar homes in the area
Home Values in the Area
Average Home Value in this Area
Purchase History
| Date | Buyer | Sale Price | Title Company |
|---|---|---|---|
| Triple M Mazel Llc | $23,500 | None Available | |
| Pierce Jerry | $97,500 | First American Title | |
| First Midwest Trust Company | $51,000 | -- | |
| Nathaniel Dwayne T | -- | Land Title Group Inc | |
| Nathaniel Herbert W | -- | -- |
Source: Public Records
Mortgage History
| Date | Status | Borrower | Loan Amount |
|---|---|---|---|
| Previous Owner | Pierce Jerry | $97,342 | |
| Previous Owner | Nathaniel Dwayne T | $69,700 |
Source: Public Records
Tax History Compared to Growth
Tax History
| Year | Tax Paid | Tax Assessment Tax Assessment Total Assessment is a certain percentage of the fair market value that is determined by local assessors to be the total taxable value of land and additions on the property. | Land | Improvement |
|---|---|---|---|---|
| 2024 | $2,308 | $8,200 | $2,268 | $5,932 |
| 2023 | $2,476 | $10,913 | $4,914 | $5,999 |
| 2022 | $2,476 | $12,000 | $4,914 | $7,086 |
| 2021 | $2,420 | $12,000 | $4,914 | $7,086 |
| 2020 | $2,295 | $10,278 | $3,024 | $7,254 |
| 2019 | $2,300 | $11,420 | $3,024 | $8,396 |
| 2018 | $2,261 | $11,420 | $3,024 | $8,396 |
| 2017 | $2,562 | $11,874 | $2,646 | $9,228 |
| 2016 | $2,384 | $11,874 | $2,646 | $9,228 |
| 2015 | $2,181 | $11,874 | $2,646 | $9,228 |
| 2014 | $1,436 | $10,291 | $2,268 | $8,023 |
| 2013 | $1,609 | $11,455 | $2,268 | $9,187 |
Source: Public Records
Map
Nearby Homes
- 10855 S Eberhart Ave
- 10718 S Rhodes Ave
- 519 E 109th St
- 408 E 107th St
- 10947 S King Dr
- 10755 S Champlain Ave
- 613 E 107th St
- 10734 S Langley Ave
- 10710 S Langley Ave
- 11022 S Vernon Ave
- 10721 S Prairie Ave
- 10642 S Langley Ave
- 10611 S Cottage Grove Ave
- 10734 S Prairie Ave
- 10742 S Prairie Ave
- 10722 S Prairie Ave
- 10553 S Calumet Ave
- 10614 S Langley Ave
- 10617 S Prairie Ave
- 201 E 107th St
- 10811 S Eberhart Ave
- 10805 S Eberhart Ave
- 10823 S Eberhart Ave
- 10801 S Eberhart Ave
- 10829 S Eberhart Ave
- 10812 S Rhodes Ave
- 10814 S Rhodes Ave
- 10818 S Rhodes Ave
- 10804 S Rhodes Ave
- 10822 S Rhodes Ave
- 10831 S Eberhart Ave
- 10826 S Rhodes Ave
- 10800 S Rhodes Ave
- 10814 S Eberhart Ave
- 10810 S Eberhart Ave
- 10816 S Eberhart Ave
- 10820 S Eberhart Ave
- 10808 S Eberhart Ave
- 10835 S Eberhart Ave
- 10828 S Rhodes Ave