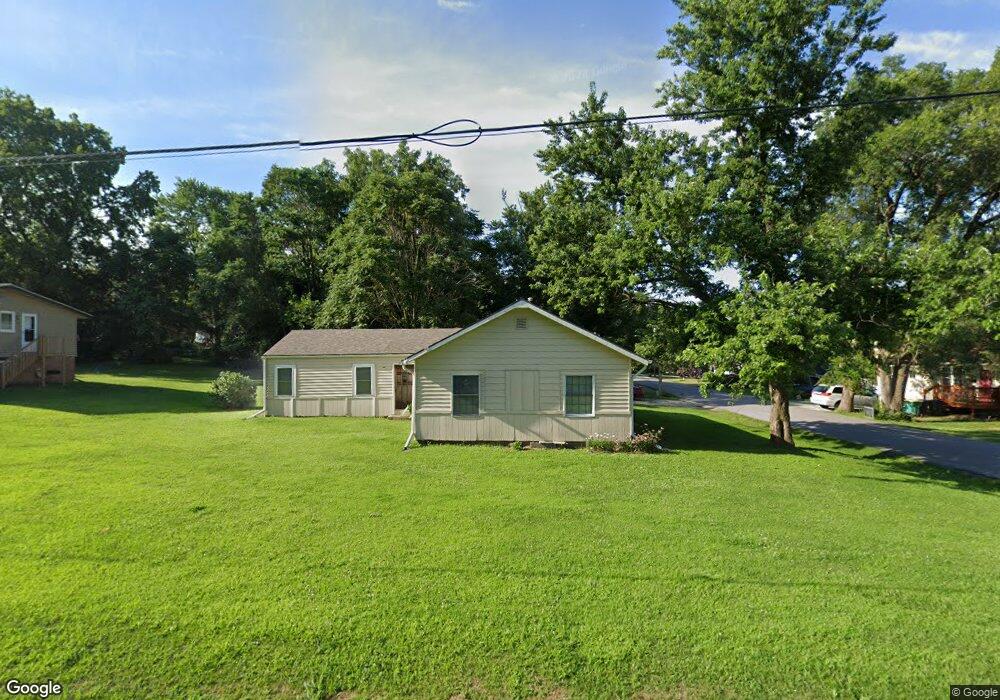
10815 W 57th St Shawnee, KS 66203
Estimated Value: $261,098 - $293,000
2
Beds
1
Bath
1,445
Sq Ft
$193/Sq Ft
Est. Value
About This Home
This home is located at 10815 W 57th St, Shawnee, KS 66203 and is currently estimated at $279,525, approximately $193 per square foot. 10815 W 57th St is a home located in Johnson County with nearby schools including Bluejacket / Flint Elementary, Hocker Grove Middle School, and Shawnee Mission North High School.
Create a Home Valuation Report for This Property
The Home Valuation Report is an in-depth analysis detailing your home's value as well as a comparison with similar homes in the area
Home Values in the Area
Average Home Value in this Area
Tax History Compared to Growth
Tax History
| Year | Tax Paid | Tax Assessment Tax Assessment Total Assessment is a certain percentage of the fair market value that is determined by local assessors to be the total taxable value of land and additions on the property. | Land | Improvement |
|---|---|---|---|---|
| 2024 | $2,492 | $23,932 | $4,952 | $18,980 |
| 2023 | $2,480 | $23,219 | $4,952 | $18,267 |
| 2022 | $2,367 | $22,069 | $4,574 | $17,495 |
| 2021 | $2,237 | $19,424 | $3,976 | $15,448 |
| 2020 | $2,005 | $17,158 | $3,609 | $13,549 |
| 2019 | $1,946 | $16,641 | $3,012 | $13,629 |
| 2018 | $1,476 | $14,271 | $2,694 | $11,577 |
| 2017 | $1,620 | $13,547 | $2,694 | $10,853 |
| 2016 | $1,399 | $11,523 | $2,694 | $8,829 |
| 2015 | $1,274 | $11,051 | $2,694 | $8,357 |
| 2013 | -- | $11,212 | $2,694 | $8,518 |
Source: Public Records
Map
Nearby Homes
- 11002 W 55th Terrace
- The Fleetwood Plan at Bristol Highlands - The Villas
- The Fleetwood Plan at Bristol Highlands - The Manors
- The Kirkwood Plan at Bristol Highlands - The Villas
- 8013 Payne St
- The Rockwood Plan at Bristol Highlands - The Villas
- 5308 Mcanany Dr
- 10116 W 52nd Terrace
- 11403 W 51st Terrace
- 11815 W 53rd St
- 5407 Halsey St
- 9929 W 52nd St
- 9719 W 53rd St
- 6420 Ballentine St
- 5504 Monrovia St
- 5845 Caenen St
- 10511 W 49th Place
- 12508 W 56th St
- 5517 Hayes St
- 13126 W 52nd Terrace
- 10811 W 57th St
- 10824 W 57th Terrace
- 10810 W 57th Terrace
- 10901 W 57th St
- 5718 Bluejacket St
- 5704 Ballentine St
- 10900 W 57th St
- 5720 Bluejacket St
- 10802 W 57th Terrace
- 10902 W 57th Terrace
- 10913 W 57th St
- 10808 W 57th St
- 10912 W 57th St
- 10910 W 57th St
- 10722 W 57th St
- 10910 W 57th Terrace
- 10821 W 57th Terrace
- 10815 W 57th Terrace
- 10715 W 57th St
- 5705 Reeder St