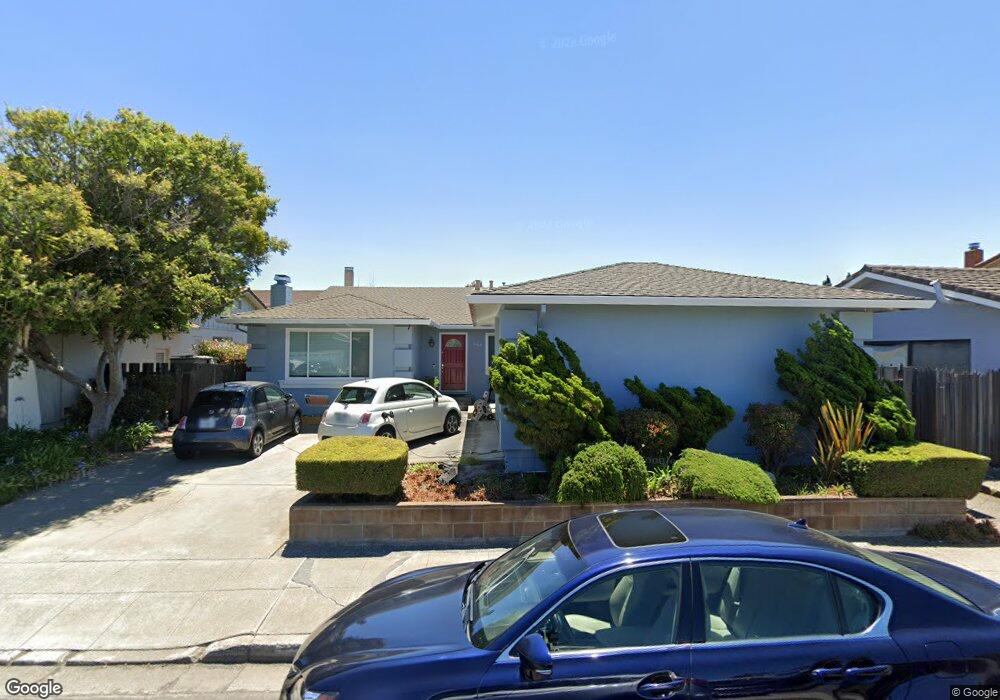
1082 Egret St Foster City, CA 94404
Bay Vista NeighborhoodEstimated Value: $2,040,000 - $2,180,000
4
Beds
2
Baths
1,890
Sq Ft
$1,105/Sq Ft
Est. Value
About This Home
This home is located at 1082 Egret St, Foster City, CA 94404 and is currently estimated at $2,089,091, approximately $1,105 per square foot. 1082 Egret St is a home with nearby schools including Audubon Elementary School, Bowditch Middle School, and San Mateo High School.
Ownership History
Date
Name
Owned For
Owner Type
Purchase Details
Closed on
Jun 9, 2022
Sold by
Ishikawa Jeffrey M and Ishikawa Sheriann J
Bought by
Ishikawa Jeffrey M
Current Estimated Value
Home Financials for this Owner
Home Financials are based on the most recent Mortgage that was taken out on this home.
Original Mortgage
$500,000
Interest Rate
5.25%
Mortgage Type
Credit Line Revolving
Purchase Details
Closed on
Sep 18, 2021
Sold by
Ishikawa Jeffrey M and Chaw Sheriann J
Bought by
Ishikawa Jeffrey M and Chaw Sheriann J
Purchase Details
Closed on
Oct 13, 2004
Sold by
Penpraze Charles L and Penpraze Shirley M
Bought by
Ishikawa Jeffrey M and Chaw Sheriann J
Home Financials for this Owner
Home Financials are based on the most recent Mortgage that was taken out on this home.
Original Mortgage
$600,000
Interest Rate
4.87%
Mortgage Type
Purchase Money Mortgage
Create a Home Valuation Report for This Property
The Home Valuation Report is an in-depth analysis detailing your home's value as well as a comparison with similar homes in the area
Home Values in the Area
Average Home Value in this Area
Purchase History
| Date | Buyer | Sale Price | Title Company |
|---|---|---|---|
| Ishikawa Jeffrey M | -- | Placer Title | |
| Ishikawa Jeffrey M | -- | Placer Title | |
| Ishikawa Jeffrey M | -- | None Available | |
| Ishikawa Jeffrey M | $825,000 | Chicago Title Insurance Comp |
Source: Public Records
Mortgage History
| Date | Status | Borrower | Loan Amount |
|---|---|---|---|
| Previous Owner | Ishikawa Jeffrey M | $500,000 | |
| Previous Owner | Ishikawa Jeffrey M | $600,000 | |
| Closed | Ishikawa Jeffrey M | $100,000 |
Source: Public Records
Tax History Compared to Growth
Tax History
| Year | Tax Paid | Tax Assessment Tax Assessment Total Assessment is a certain percentage of the fair market value that is determined by local assessors to be the total taxable value of land and additions on the property. | Land | Improvement |
|---|---|---|---|---|
| 2025 | $14,127 | $1,205,593 | $574,980 | $630,613 |
| 2023 | $14,127 | $1,158,780 | $552,653 | $606,127 |
| 2022 | $13,653 | $1,136,060 | $541,817 | $594,243 |
| 2021 | $13,476 | $1,113,787 | $531,194 | $582,593 |
| 2020 | $13,107 | $1,102,368 | $525,748 | $576,620 |
| 2019 | $12,421 | $1,080,755 | $515,440 | $565,315 |
| 2018 | $11,908 | $1,059,566 | $505,334 | $554,232 |
| 2017 | $11,776 | $1,038,792 | $495,426 | $543,366 |
| 2016 | $11,213 | $971,424 | $485,712 | $485,712 |
| 2015 | $10,953 | $956,834 | $478,417 | $478,417 |
| 2014 | $10,676 | $938,092 | $469,046 | $469,046 |
Source: Public Records
Map
Nearby Homes
- 275 Puffin Ct
- 224 Loon Ct
- 888 Sea Island Ln
- 1925 Beach Park Blvd
- 221 Shearwater Isle
- 1463 Marlin Ave
- 1074 Eagle Ln
- 752 Matsonia Dr
- 212 Albacore Ln Unit D202
- 591 Pilgrim Dr
- 1102 Admiralty Ln
- 3206 Admiralty Ln
- 1100 Bounty Dr
- 387 Menhaden Ct
- 708 Thayer Ln Unit 404
- 769 Eppleton Ln Unit 302
- 1028 Foster Square Ln Unit 305
- 708 Eppleton Ln Unit 204
- 718 Eppleton Ln Unit 303
- 370 Bramble Ct
- 1066 Egret St
- 1791 Beach Park Blvd
- 207 Pelican Ct
- 1050 Egret St
- 1083 Egret St
- 1067 Egret St
- 203 Pelican Ct
- 1099 Egret St
- 1785 Beach Park Blvd
- 1032 Egret St
- 1049 Egret St
- 211 Pelican Ct
- 200 Pelican Ct
- 1033 Egret St
- 1777 Beach Park Blvd
- 1805 Beach Park Blvd
- 1016 Egret St
- 286 Puffin Ct
- 291 Puffin Ct
- 221 Pelican Ct