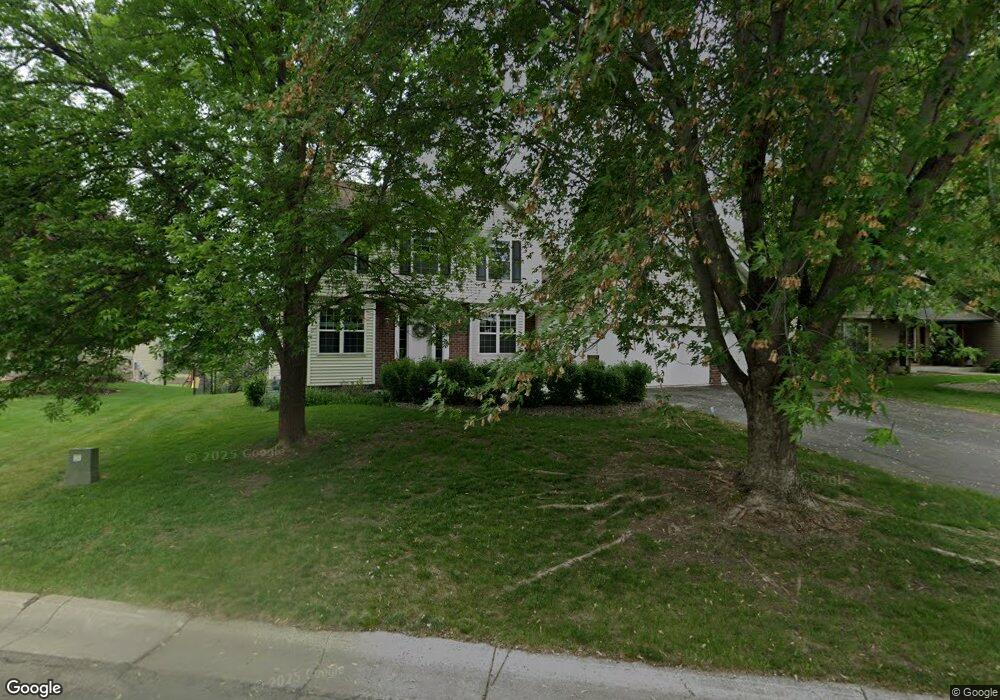
1082 Pond Curve Waconia, MN 55387
Estimated Value: $492,618 - $544,000
4
Beds
3
Baths
3,120
Sq Ft
$166/Sq Ft
Est. Value
About This Home
This home is located at 1082 Pond Curve, Waconia, MN 55387 and is currently estimated at $518,905, approximately $166 per square foot. 1082 Pond Curve is a home located in Carver County with nearby schools including Bayview Elementary School, Waconia Middle School, and Waconia High School.
Ownership History
Date
Name
Owned For
Owner Type
Purchase Details
Closed on
Feb 21, 2020
Sold by
Sph Property Three Llc
Bought by
Lee Johanna Cathryn and Lawin Peter James
Current Estimated Value
Home Financials for this Owner
Home Financials are based on the most recent Mortgage that was taken out on this home.
Original Mortgage
$234,000
Outstanding Balance
$207,191
Interest Rate
3.6%
Mortgage Type
New Conventional
Estimated Equity
$311,714
Purchase Details
Closed on
Nov 27, 2019
Sold by
Moore Teresa L and Moore Lawrence E
Bought by
Sph Property Three Llc
Purchase Details
Closed on
Oct 22, 2007
Sold by
Francen Evan B and Francen Marlyce
Bought by
King Teresa L
Home Financials for this Owner
Home Financials are based on the most recent Mortgage that was taken out on this home.
Original Mortgage
$286,662
Interest Rate
6.38%
Mortgage Type
New Conventional
Purchase Details
Closed on
Jun 7, 2002
Sold by
Trumpy Country Development L L C
Bought by
Fracen Evan B
Create a Home Valuation Report for This Property
The Home Valuation Report is an in-depth analysis detailing your home's value as well as a comparison with similar homes in the area
Home Values in the Area
Average Home Value in this Area
Purchase History
| Date | Buyer | Sale Price | Title Company |
|---|---|---|---|
| Lee Johanna Cathryn | $355,000 | Network Title Inc | |
| Sph Property Three Llc | $349,300 | Network Title Inc | |
| King Teresa L | $301,750 | -- | |
| Fracen Evan B | $279,000 | -- |
Source: Public Records
Mortgage History
| Date | Status | Borrower | Loan Amount |
|---|---|---|---|
| Open | Lee Johanna Cathryn | $234,000 | |
| Previous Owner | King Teresa L | $286,662 |
Source: Public Records
Tax History Compared to Growth
Tax History
| Year | Tax Paid | Tax Assessment Tax Assessment Total Assessment is a certain percentage of the fair market value that is determined by local assessors to be the total taxable value of land and additions on the property. | Land | Improvement |
|---|---|---|---|---|
| 2025 | $5,910 | $487,900 | $125,000 | $362,900 |
| 2024 | $5,806 | $471,400 | $105,000 | $366,400 |
| 2023 | $5,612 | $476,500 | $105,000 | $371,500 |
| 2022 | $5,278 | $472,200 | $96,800 | $375,400 |
| 2021 | $5,208 | $369,900 | $80,600 | $289,300 |
| 2020 | $4,812 | $369,900 | $80,600 | $289,300 |
| 2019 | $4,606 | $318,200 | $66,900 | $251,300 |
| 2018 | $4,402 | $318,200 | $66,900 | $251,300 |
| 2017 | $4,362 | $320,900 | $66,900 | $254,000 |
| 2016 | $4,664 | $335,500 | $0 | $0 |
| 2015 | $3,962 | $312,900 | $0 | $0 |
| 2014 | $3,962 | $262,800 | $0 | $0 |
Source: Public Records
Map
Nearby Homes
- 329 Sunflower Cir
- 1010 Goldenrod Trail
- 1012 Goldenrod Trail
- 726 Winterberry Ln
- 722 Winterberry Ln
- 720 Winterberry Ln
- 610 Goldenrod Trail
- 718 Winterberry Ln
- 716 Winterberry Ln
- 1034 Goldenrod Trail
- 714 Winterberry Ln
- 1036 Goldenrod Trail
- 712 Winterberry Ln
- 930 Foxglove Terrace
- The Henry Plan at The Fields of Waconia - Tradition
- The Holcombe Plan at The Fields of Waconia - Express Select
- The Whitney Plan at The Fields of Waconia - Tradition
- The Clifton II Plan at The Fields of Waconia - Tradition
- The Jordan Plan at The Fields of Waconia - Tradition
- 526 Goldenrod Trail
- 1088 Pond Curve
- 1076 Pond Curve
- 1094 Pond Curve
- 1083 Pond Curve
- 1077 Pond Curve
- 1089 Pond Curve
- 1070 Pond Curve
- 1100 Pond Curve
- 1065 Pond Curve
- 1101 Pond Curve
- 1058 Pond Curve
- 1108 Pond Curve
- 1053 Pond Curve
- 1052 Pond Curve
- 1725 Waconia Pkwy S
- 1775 Waconia Pkwy S
- 1755 Waconia Pkwy S
- 1736 Pond Ln
- 1116 Pond Curve
- 1724 Pond Ln