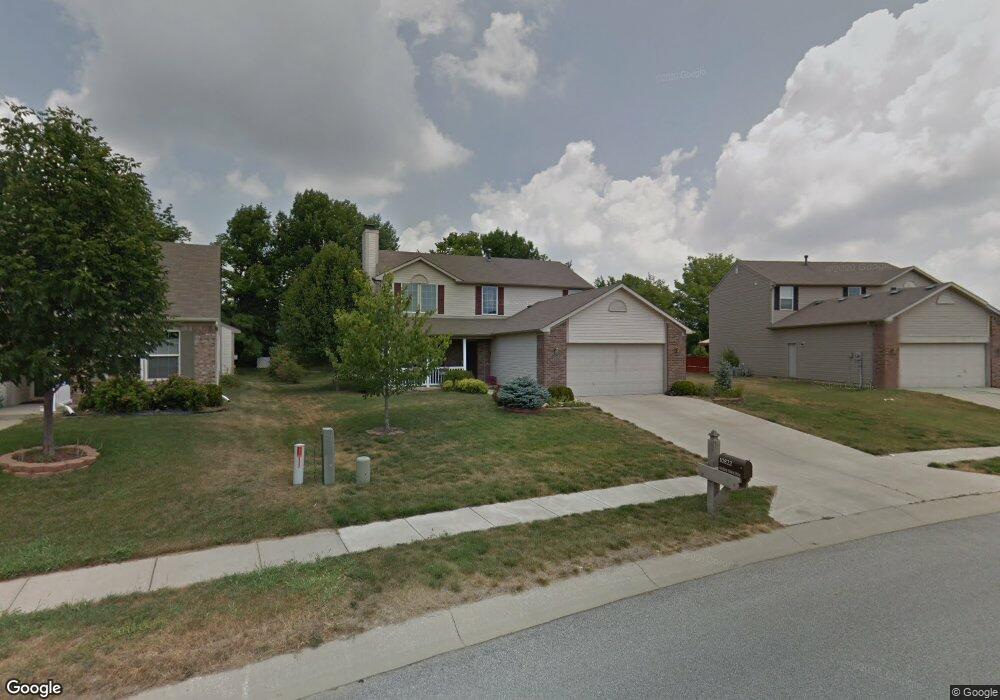
10822 Northern Dancer Dr Indianapolis, IN 46234
Estimated Value: $309,000 - $338,000
3
Beds
3
Baths
2,024
Sq Ft
$159/Sq Ft
Est. Value
About This Home
This home is located at 10822 Northern Dancer Dr, Indianapolis, IN 46234 and is currently estimated at $322,175, approximately $159 per square foot. 10822 Northern Dancer Dr is a home located in Hendricks County with nearby schools including White Oak Elementary School, River Birch Elementary School, and Avon Middle School North.
Ownership History
Date
Name
Owned For
Owner Type
Purchase Details
Closed on
Oct 30, 2018
Sold by
Primrose Trust
Bought by
Hardman John A and Hardman Jennifer P
Current Estimated Value
Home Financials for this Owner
Home Financials are based on the most recent Mortgage that was taken out on this home.
Original Mortgage
$141,600
Outstanding Balance
$124,254
Interest Rate
4.7%
Mortgage Type
New Conventional
Estimated Equity
$197,921
Create a Home Valuation Report for This Property
The Home Valuation Report is an in-depth analysis detailing your home's value as well as a comparison with similar homes in the area
Home Values in the Area
Average Home Value in this Area
Purchase History
| Date | Buyer | Sale Price | Title Company |
|---|---|---|---|
| Hardman John A | -- | None Available |
Source: Public Records
Mortgage History
| Date | Status | Borrower | Loan Amount |
|---|---|---|---|
| Open | Hardman John A | $141,600 |
Source: Public Records
Tax History Compared to Growth
Tax History
| Year | Tax Paid | Tax Assessment Tax Assessment Total Assessment is a certain percentage of the fair market value that is determined by local assessors to be the total taxable value of land and additions on the property. | Land | Improvement |
|---|---|---|---|---|
| 2024 | $3,427 | $304,300 | $37,700 | $266,600 |
| 2023 | $3,154 | $279,400 | $34,600 | $244,800 |
| 2022 | $2,971 | $265,300 | $32,000 | $233,300 |
| 2021 | $2,644 | $230,100 | $29,600 | $200,500 |
| 2020 | $2,391 | $210,800 | $29,600 | $181,200 |
| 2019 | $2,407 | $209,500 | $29,000 | $180,500 |
| 2018 | $2,232 | $187,600 | $29,000 | $158,600 |
| 2017 | $1,801 | $180,100 | $27,600 | $152,500 |
| 2016 | $1,757 | $175,700 | $27,600 | $148,100 |
| 2014 | $1,597 | $159,700 | $25,000 | $134,700 |
Source: Public Records
Map
Nearby Homes
- 2382 Black Gold Dr
- 2350 Seattle Slew Dr
- 2283 Seattle Slew Dr
- 10762 Galant Fox Ct
- 2600 N Raceway Rd
- 10583 Northern Dancer Dr
- 2205 Whitecliff Dr
- Addison Plan at
- Clark Plan at
- Manchester Plan at
- Buckner Plan at
- Grant Plan at
- Waveland Plan at
- Concord Plan at
- 8841 Mallard Green Dr
- 9123 Tansel Park Ct
- 8830 Sunningdale Blvd
- 10163 Union St
- 3013 Tansel Rd
- 2815 Singletree Dr
- 10812 Northern Dancer Dr
- 10832 Northern Dancer Dr
- 10798 Northern Dancer Dr
- 2405 Black Gold Dr
- 10784 Northern Dancer Dr
- 2413 Seattle Slew Dr
- 2393 Black Gold Dr
- 2399 Seattle Slew Dr
- 2386 Whirlaway Ct
- 2381 Black Gold Dr
- 2390 Whirlaway Ct
- 10772 Northern Dancer Dr
- 2387 Seattle Slew Dr
- 2367 Black Gold Dr
- 2374 Whirlaway Ct
- 2416 Seattle Slew Dr
- 10760 Northern Dancer Dr
- 2373 Seattle Slew Dr
- 2354 Black Gold Dr
- 2402 Seattle Slew Dr