1083 220th St Tipton, IA 52772
Estimated Value: $304,000 - $373,000
3
Beds
1
Bath
2,096
Sq Ft
$161/Sq Ft
Est. Value
About This Home
This home is located at 1083 220th St, Tipton, IA 52772 and is currently estimated at $338,500, approximately $161 per square foot. 1083 220th St is a home located in Cedar County with nearby schools including Tipton Elementary School, Tipton Middle School, and Tipton High School.
Ownership History
Date
Name
Owned For
Owner Type
Purchase Details
Closed on
Jun 11, 2021
Sold by
Christine Meier Arnie
Bought by
Meier Jacob Dean
Current Estimated Value
Purchase Details
Closed on
May 30, 2019
Sold by
Brennan Jo A
Bought by
Meier Jacob D and Meier Amie C
Home Financials for this Owner
Home Financials are based on the most recent Mortgage that was taken out on this home.
Original Mortgage
$310,500
Interest Rate
4.1%
Mortgage Type
New Conventional
Purchase Details
Closed on
Jan 8, 2019
Sold by
Brennan Robert J
Bought by
Brennan Jo A
Purchase Details
Closed on
Jan 11, 2013
Sold by
Brennan Robert James and Brennan Jo Ann
Bought by
Brennan Robert James and Brennan Jo Ann
Create a Home Valuation Report for This Property
The Home Valuation Report is an in-depth analysis detailing your home's value as well as a comparison with similar homes in the area
Home Values in the Area
Average Home Value in this Area
Purchase History
| Date | Buyer | Sale Price | Title Company |
|---|---|---|---|
| Meier Jacob Dean | -- | None Listed On Document | |
| Meier Jacob D | $270,000 | -- | |
| Brennan Jo A | -- | -- | |
| Brennan Robert James | -- | None Available |
Source: Public Records
Mortgage History
| Date | Status | Borrower | Loan Amount |
|---|---|---|---|
| Previous Owner | Meier Jacob D | $310,500 |
Source: Public Records
Tax History Compared to Growth
Tax History
| Year | Tax Paid | Tax Assessment Tax Assessment Total Assessment is a certain percentage of the fair market value that is determined by local assessors to be the total taxable value of land and additions on the property. | Land | Improvement |
|---|---|---|---|---|
| 2025 | $578 | $409,440 | $13,730 | $395,710 |
| 2024 | $578 | $34,680 | $11,280 | $23,400 |
| 2023 | $1,712 | $141,870 | $11,280 | $130,590 |
| 2022 | $1,590 | $118,100 | $8,780 | $109,320 |
| 2021 | $2,490 | $118,100 | $8,780 | $109,320 |
| 2020 | $1,446 | $107,860 | $9,410 | $98,450 |
| 2019 | $1,154 | $105,610 | $9,410 | $98,450 |
| 2018 | $2,160 | $188,840 | $0 | $0 |
| 2017 | $2,160 | $204,840 | $0 | $0 |
| 2016 | $2,210 | $204,840 | $0 | $0 |
| 2015 | $2,238 | $201,140 | $0 | $0 |
| 2014 | $2,238 | $201,140 | $0 | $0 |
Source: Public Records
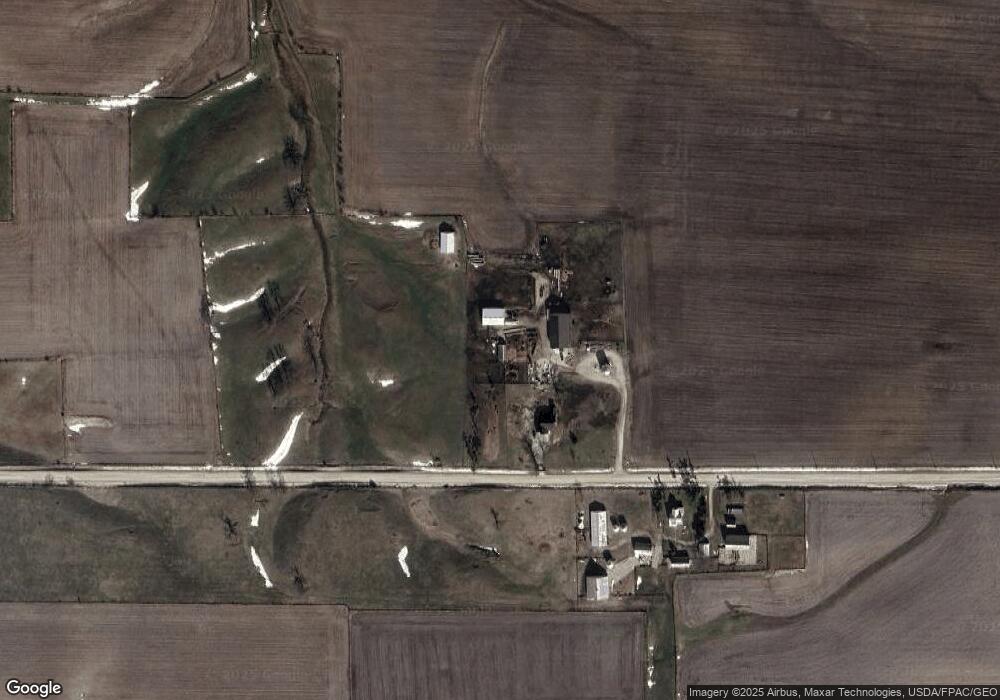
Map
Nearby Homes