
Seller's Agent in 2025
Jarod Snover
Iowa Realty Mills Crossing
(515) 480-7721
3 in this area
58 Total Sales
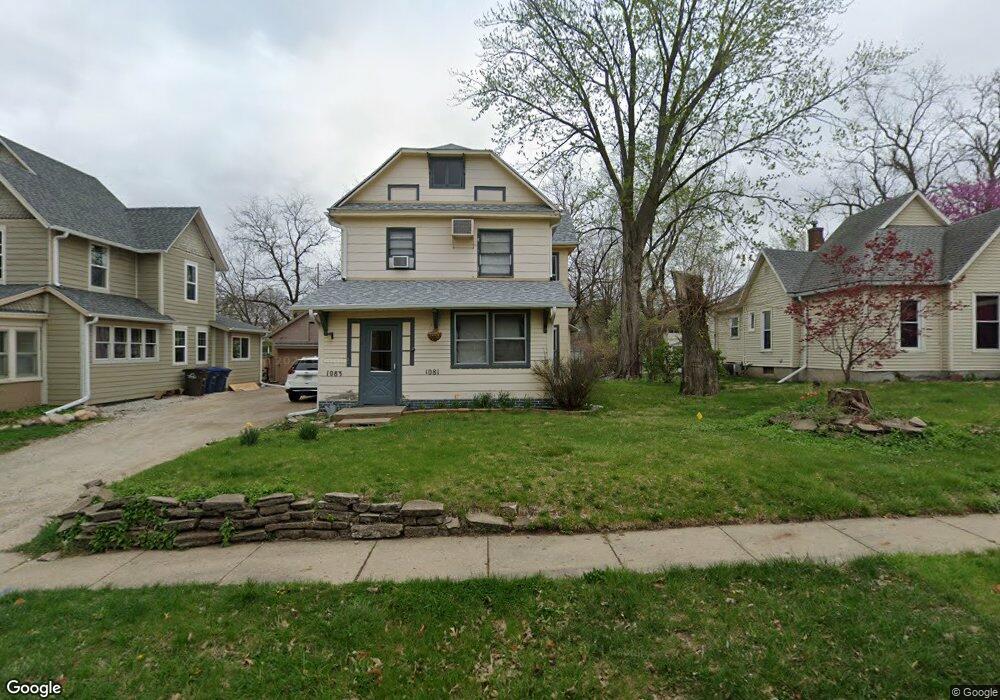
This home is located at 1083 36th St, Des Moines, IA 50311 and is currently priced at $152,500, approximately $95 per square foot. This property was built in 1895. 1083 36th St is a home located in Polk County with nearby schools including Hubbell Elementary, Callanan Middle School, and Roosevelt High School.
| Date | Type | Sale Price | Title Company |
|---|---|---|---|
| Warranty Deed | $152,500 | None Listed On Document | |
| Quit Claim Deed | -- | None Available | |
| Warranty Deed | $45,500 | -- |
| Date | Status | Loan Amount | Loan Type |
|---|---|---|---|
| Open | $149,737 | FHA |
| Date | Event | Price | List to Sale | Price per Sq Ft |
|---|---|---|---|---|
| 09/26/2025 09/26/25 | Sold | $152,500 | 0.0% | $96 / Sq Ft |
| 09/08/2025 09/08/25 | Pending | -- | -- | -- |
| 09/06/2025 09/06/25 | For Sale | $152,500 | -- | $96 / Sq Ft |
| Year | Tax Paid | Tax Assessment Tax Assessment Total Assessment is a certain percentage of the fair market value that is determined by local assessors to be the total taxable value of land and additions on the property. | Land | Improvement |
|---|---|---|---|---|
| 2025 | $3,130 | $175,600 | $51,700 | $123,900 |
| 2024 | $3,130 | $159,100 | $46,700 | $112,400 |
| 2023 | $3,184 | $159,100 | $46,700 | $112,400 |
| 2022 | $3,160 | $135,100 | $41,000 | $94,100 |
| 2021 | $3,016 | $135,100 | $41,000 | $94,100 |
| 2020 | $3,134 | $120,900 | $37,000 | $83,900 |
| 2019 | $2,846 | $120,900 | $37,000 | $83,900 |
| 2018 | $2,586 | $105,900 | $32,100 | $73,800 |
| 2017 | $2,388 | $105,900 | $32,100 | $73,800 |
| 2016 | $2,504 | $96,800 | $29,300 | $67,500 |
| 2015 | $2,322 | $96,800 | $29,300 | $67,500 |
| 2014 | $2,086 | $87,200 | $26,300 | $60,900 |
Seller's Agent in 2025
Jarod Snover
Iowa Realty Mills Crossing
(515) 480-7721
3 in this area
58 Total Sales
Source: Des Moines Area Association of REALTORS®
MLS Number: 725790
APN: 090-07226000000
Disclaimer: Certain information contained herein is derived from information provided by parties other than Homes.com. All information provided is deemed reliable, but is not guaranteed to be accurate and should be independently verified.
![]() IDX information is provided exclusively for personal, non-commercial use, and may not be used for any purpose other than to identify prospective properties consumers may be interested in purchasing. Information is deemed reliable but not guaranteed.
IDX information is provided exclusively for personal, non-commercial use, and may not be used for any purpose other than to identify prospective properties consumers may be interested in purchasing. Information is deemed reliable but not guaranteed.