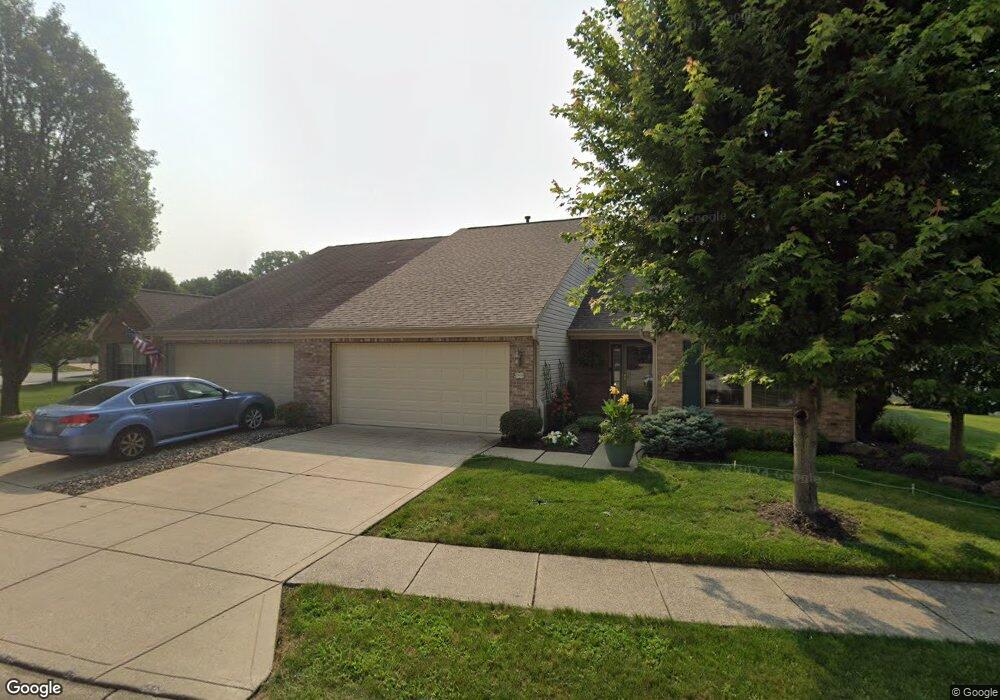
10837 Tolliston Ln Indianapolis, IN 46236
Estimated Value: $276,000 - $290,000
2
Beds
2
Baths
1,712
Sq Ft
$165/Sq Ft
Est. Value
About This Home
This home is located at 10837 Tolliston Ln, Indianapolis, IN 46236 and is currently estimated at $282,339, approximately $164 per square foot. 10837 Tolliston Ln is a home located in Marion County with nearby schools including Sunnyside Elementary School, Fall Creek Valley Middle School, and Lawrence North High School.
Ownership History
Date
Name
Owned For
Owner Type
Purchase Details
Closed on
Jul 28, 2016
Sold by
Hollowell Valerie Ann
Bought by
Jett Dale and Jett Lilly
Current Estimated Value
Home Financials for this Owner
Home Financials are based on the most recent Mortgage that was taken out on this home.
Original Mortgage
$145,000
Outstanding Balance
$115,693
Interest Rate
3.48%
Mortgage Type
VA
Estimated Equity
$166,646
Purchase Details
Closed on
May 5, 2010
Sold by
Carpenter Gary D and Hildebrandt Sherrie L
Bought by
Hollowell Ronald L
Home Financials for this Owner
Home Financials are based on the most recent Mortgage that was taken out on this home.
Original Mortgage
$134,685
Interest Rate
5.5%
Mortgage Type
FHA
Purchase Details
Closed on
Dec 28, 2005
Sold by
Carpenter Betty A
Bought by
Carpenter Gary D and Hildebrandt Sherrie L
Create a Home Valuation Report for This Property
The Home Valuation Report is an in-depth analysis detailing your home's value as well as a comparison with similar homes in the area
Home Values in the Area
Average Home Value in this Area
Purchase History
| Date | Buyer | Sale Price | Title Company |
|---|---|---|---|
| Jett Dale | -- | Chicago Title Company Llc | |
| Hollowell Ronald L | -- | None Available | |
| Carpenter Gary D | -- | None Available |
Source: Public Records
Mortgage History
| Date | Status | Borrower | Loan Amount |
|---|---|---|---|
| Open | Jett Dale | $145,000 | |
| Previous Owner | Hollowell Ronald L | $134,685 |
Source: Public Records
Tax History Compared to Growth
Tax History
| Year | Tax Paid | Tax Assessment Tax Assessment Total Assessment is a certain percentage of the fair market value that is determined by local assessors to be the total taxable value of land and additions on the property. | Land | Improvement |
|---|---|---|---|---|
| 2024 | $1,737 | $229,600 | $35,100 | $194,500 |
| 2023 | $1,737 | $224,100 | $35,100 | $189,000 |
| 2022 | $2,003 | $207,400 | $35,100 | $172,300 |
| 2021 | $1,429 | $187,500 | $35,100 | $152,400 |
| 2020 | $1,125 | $168,900 | $24,400 | $144,500 |
| 2019 | $922 | $160,900 | $24,400 | $136,500 |
| 2018 | $857 | $155,900 | $24,400 | $131,500 |
| 2017 | $676 | $144,500 | $24,400 | $120,100 |
| 2016 | $1,684 | $164,100 | $24,400 | $139,700 |
| 2014 | $1,587 | $158,700 | $24,400 | $134,300 |
| 2013 | $1,574 | $157,400 | $24,400 | $133,000 |
Source: Public Records
Map
Nearby Homes
- 10908 Tolliston Ln
- 10570 Camille Ct
- 10612 Prestbury Dr
- 10629 Simsbury Ct
- 10475 Bartley Dr
- 6442 Royal Oakland Dr
- 10249 Winlee Ct
- 11435 E 63rd St
- 11135 Pendleton Pike
- 10160 Pendleton Pike
- 10339 Colville Ln
- 6485 Timber Leaf Ln
- 6415 Finch Dr
- 11057 Turfgrass Way
- 6137 Sandcherry Dr
- 10770 Indian Lake Blvd S
- 11638 Indian Creek Rd
- 11813 Marling Way
- 6610 Royal Oakland Dr
- 6002 Draycott Dr
- 10853 Tolliston Ln
- 10835 Tolliston Ln
- 10819 Tolliston Ln
- 10855 Tolliston Ln
- 10855 Tolliston Ln Unit 1
- 10844 Tolliston Ln
- 10844 Tolliston Ln Unit 10844
- 10844 Tolliston Ln Unit 8
- 10850 Tolliston Ln
- 10852 Tolliston Ln
- 10842 Tolliston Ln
- 10817 Tolliston Ln
- 10817 Tolliston Ln Unit 19
- 10915 Tolliston Ln
- 10915 Tolliston Ln Unit 25
- 10828 Tolliston Ln
- 10828 Tolliston Ln Unit 4
- 10834 Tolliston Ln
- 10834 Tolliston Ln Unit 5
- 10858 Tolliston Ln