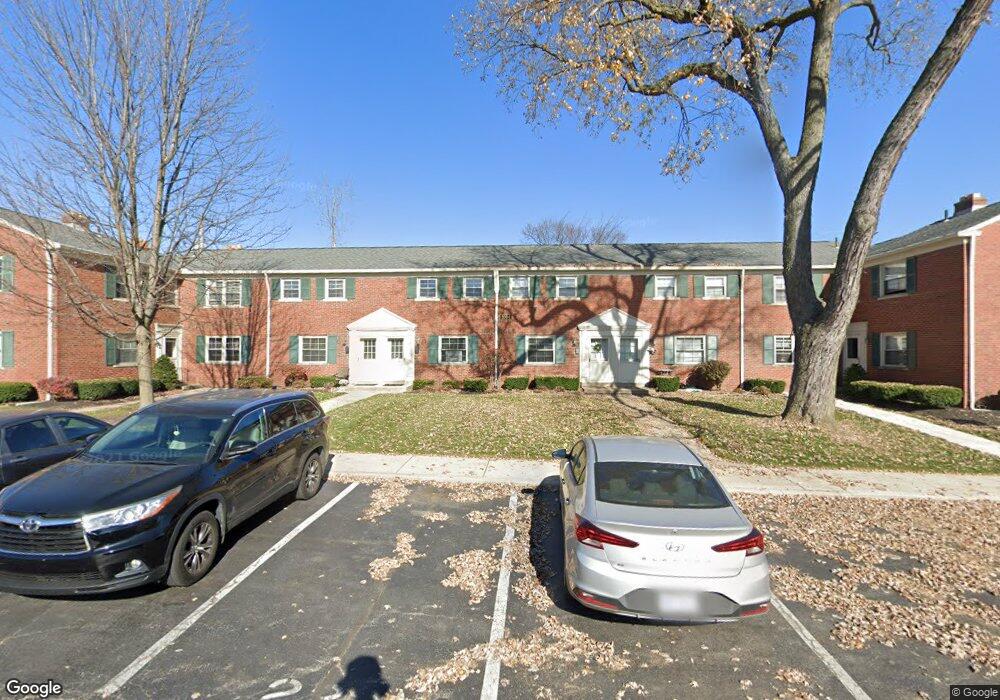
1084 Sells Ave Unit 88 Columbus, OH 43212
Tri-Village NeighborhoodEstimated Value: $126,000 - $158,000
1
Bed
1
Bath
606
Sq Ft
$236/Sq Ft
Est. Value
About This Home
This home is located at 1084 Sells Ave Unit 88, Columbus, OH 43212 and is currently estimated at $143,140, approximately $236 per square foot. 1084 Sells Ave Unit 88 is a home located in Franklin County with nearby schools including Cranbrook Elementary School, Ridgeview Middle School, and Centennial High School.
Ownership History
Date
Name
Owned For
Owner Type
Purchase Details
Closed on
Jun 7, 2024
Sold by
Pivetz Lynda L
Bought by
Keller Christopher W
Current Estimated Value
Home Financials for this Owner
Home Financials are based on the most recent Mortgage that was taken out on this home.
Original Mortgage
$87,000
Outstanding Balance
$85,890
Interest Rate
7.02%
Mortgage Type
New Conventional
Estimated Equity
$57,250
Purchase Details
Closed on
Dec 31, 2015
Sold by
Szymanowski Joseph R
Bought by
Pivetz Lynda L
Purchase Details
Closed on
Aug 31, 2006
Sold by
Somerset Partners Llc
Bought by
Szymanowski Joseph R
Home Financials for this Owner
Home Financials are based on the most recent Mortgage that was taken out on this home.
Original Mortgage
$53,910
Interest Rate
6.7%
Mortgage Type
Purchase Money Mortgage
Purchase Details
Closed on
Jun 25, 1981
Bought by
Klingbeil Group Inc
Create a Home Valuation Report for This Property
The Home Valuation Report is an in-depth analysis detailing your home's value as well as a comparison with similar homes in the area
Home Values in the Area
Average Home Value in this Area
Purchase History
| Date | Buyer | Sale Price | Title Company |
|---|---|---|---|
| Keller Christopher W | $157,000 | World Class Title | |
| Pivetz Lynda L | $68,400 | Title First Agency Inc | |
| Szymanowski Joseph R | $59,900 | Title First | |
| Klingbeil Group Inc | -- | -- |
Source: Public Records
Mortgage History
| Date | Status | Borrower | Loan Amount |
|---|---|---|---|
| Open | Keller Christopher W | $87,000 | |
| Previous Owner | Szymanowski Joseph R | $53,910 |
Source: Public Records
Tax History Compared to Growth
Tax History
| Year | Tax Paid | Tax Assessment Tax Assessment Total Assessment is a certain percentage of the fair market value that is determined by local assessors to be the total taxable value of land and additions on the property. | Land | Improvement |
|---|---|---|---|---|
| 2024 | $1,631 | $35,600 | $12,250 | $23,350 |
| 2023 | $1,611 | $35,595 | $12,250 | $23,345 |
| 2022 | $2,808 | $35,040 | $10,710 | $24,330 |
| 2021 | $1,865 | $35,040 | $10,710 | $24,330 |
| 2020 | $1,868 | $35,040 | $10,710 | $24,330 |
| 2019 | $1,676 | $26,960 | $8,230 | $18,730 |
| 2018 | $837 | $26,960 | $8,230 | $18,730 |
| 2017 | $1,676 | $26,960 | $8,230 | $18,730 |
| 2016 | $1,546 | $22,750 | $3,850 | $18,900 |
| 2015 | $729 | $22,750 | $3,850 | $18,900 |
| 2014 | $1,411 | $22,750 | $3,850 | $18,900 |
| 2013 | $696 | $22,750 | $3,850 | $18,900 |
Source: Public Records
Map
Nearby Homes
- 1060 Sells Ave Unit 104
- 1878 Kenny Rd
- 1736 Hess Blvd
- 1126 King Ave Unit 128
- 945 Chambers Rd
- 1500 Kenny Rd
- 00 W 7th Ave
- 1364 W 7th Ave
- 1395 Upper Green Cir Unit 1395
- 1398 Lower Green Cir Unit 1398
- 1825 Northwest Ct Unit D
- 1095 W 3rd Ave
- 1093 W 3rd Ave
- 1242 Oxley Rd
- 1083 W 3rd Ave
- 1240 Oxley Rd
- 1225 Eastview Ave
- 1661 Ashland Ave Unit 663
- 1655-1657 Ashland Ave
- 1729 Elmwood Ave
- 1084 Sells Ave Unit 89
- 1084 Sells Ave Unit 85
- 1084 Sells Ave Unit 94
- 1084 Sells Ave Unit 90
- 1084 Sells Ave Unit 93
- 1084 Sells Ave Unit 86
- 1084 Sells Ave Unit 96
- 1084 Sells Ave Unit 95
- 1084 Sells Ave Unit 87
- 1084 Sells Ave Unit 91
- 1084 Sells Ave Unit H92
- 1084 Sells Ave Unit E
- 1084 Sells Ave Unit E
- 1084 Sells Ave Unit 92-H
- 1084 Sells Ave Unit G
- 1084 Sells Ave Unit C
- 1084 Sells Ave Unit L
- 1084 Sells Ave Unit H
- 1084 Sells Ave Unit D
- 1084 Sells Ave Unit A