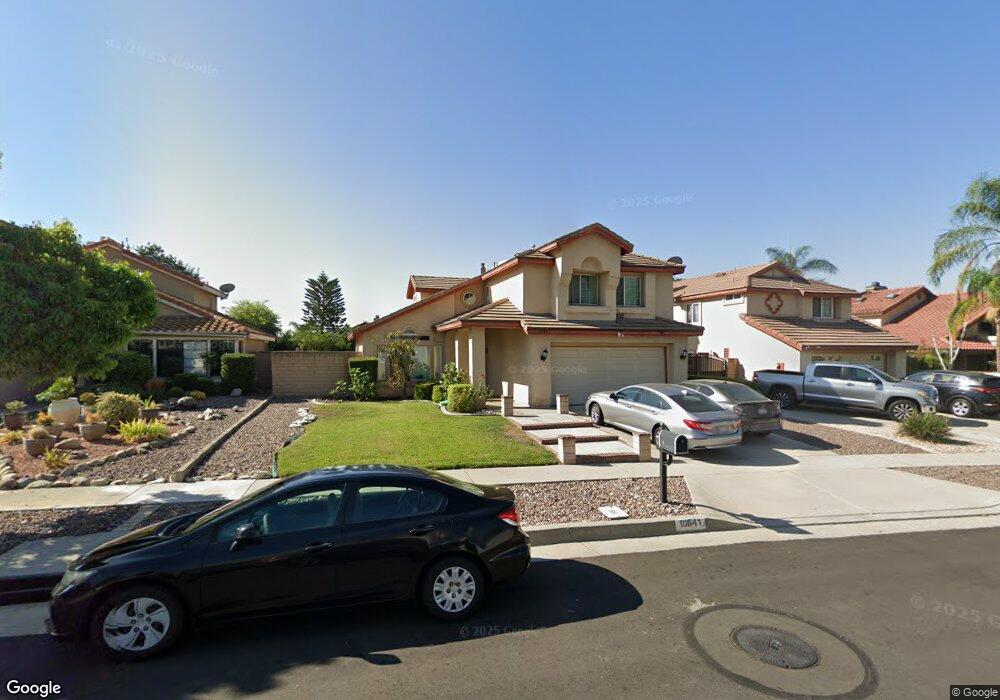
10841 Sonora Ave Rancho Cucamonga, CA 91701
Estimated Value: $830,637 - $872,000
4
Beds
3
Baths
1,924
Sq Ft
$447/Sq Ft
Est. Value
About This Home
This home is located at 10841 Sonora Ave, Rancho Cucamonga, CA 91701 and is currently estimated at $860,159, approximately $447 per square foot. 10841 Sonora Ave is a home located in San Bernardino County with nearby schools including Victoria Groves Elementary, Vineyard Junior High, and Los Osos High.
Ownership History
Date
Name
Owned For
Owner Type
Purchase Details
Closed on
Apr 2, 2014
Sold by
Baig Kauser Perveen
Bought by
Baig Kauser and The Kauser Baig Separate Prope
Current Estimated Value
Purchase Details
Closed on
Feb 4, 2005
Sold by
Baig Kauser Perveen
Bought by
Baig Kauser Perveen
Purchase Details
Closed on
Jul 9, 2002
Sold by
Baig Kauser Perveen
Bought by
Shamsi Shahab
Purchase Details
Closed on
Nov 18, 1997
Sold by
Ogunduyile Femi
Bought by
Baig Kauser Perveen
Home Financials for this Owner
Home Financials are based on the most recent Mortgage that was taken out on this home.
Original Mortgage
$125,250
Interest Rate
7.23%
Purchase Details
Closed on
Aug 15, 1995
Sold by
Cumiskey John J
Bought by
Ogunduyile Femi and Ogunduyile Akin
Home Financials for this Owner
Home Financials are based on the most recent Mortgage that was taken out on this home.
Original Mortgage
$155,100
Interest Rate
7.63%
Create a Home Valuation Report for This Property
The Home Valuation Report is an in-depth analysis detailing your home's value as well as a comparison with similar homes in the area
Home Values in the Area
Average Home Value in this Area
Purchase History
| Date | Buyer | Sale Price | Title Company |
|---|---|---|---|
| Baig Kauser | -- | None Available | |
| Baig Kauser Perveen | -- | -- | |
| Shamsi Shahab | -- | -- | |
| Baig Kauser Perveen | $167,000 | Old Republic Title Company | |
| Ogunduyile Femi | $172,500 | First American Title Ins Co |
Source: Public Records
Mortgage History
| Date | Status | Borrower | Loan Amount |
|---|---|---|---|
| Previous Owner | Baig Kauser Perveen | $125,250 | |
| Previous Owner | Ogunduyile Femi | $155,100 |
Source: Public Records
Tax History Compared to Growth
Tax History
| Year | Tax Paid | Tax Assessment Tax Assessment Total Assessment is a certain percentage of the fair market value that is determined by local assessors to be the total taxable value of land and additions on the property. | Land | Improvement |
|---|---|---|---|---|
| 2025 | $4,695 | $410,483 | $108,626 | $301,857 |
| 2024 | $4,695 | $402,434 | $106,496 | $295,938 |
| 2023 | $4,585 | $394,543 | $104,408 | $290,135 |
| 2022 | $4,562 | $386,807 | $102,361 | $284,446 |
| 2021 | $4,559 | $379,223 | $100,354 | $278,869 |
| 2020 | $4,383 | $375,335 | $99,325 | $276,010 |
| 2019 | $4,429 | $367,975 | $97,377 | $270,598 |
| 2018 | $4,335 | $360,760 | $95,468 | $265,292 |
| 2017 | $4,149 | $353,686 | $93,596 | $260,090 |
| 2016 | $4,043 | $346,751 | $91,761 | $254,990 |
| 2015 | $4,019 | $341,543 | $90,383 | $251,160 |
| 2014 | $3,920 | $334,853 | $88,613 | $246,240 |
Source: Public Records
Map
Nearby Homes
- 6572 San Benito Ave
- 10980 Santa Barbara Place
- 6516 Alameda Ave
- 6915 Stanislaus Place
- 10815 Plumas Rd
- 10672 Finch Ave
- 6842 Palm Dr
- 10655 Lemon Ave Unit 2703
- 10655 Lemon Ave Unit 2605
- 10655 Lemon Ave Unit 3613
- 10655 Lemon Ave Unit 4004
- 10655 Lemon Ave Unit 1710
- 10655 Lemon Ave Unit 4009
- 10655 Lemon Ave Unit 1508
- 10655 Lemon Ave Unit 2402
- 10655 Lemon Ave Unit 3912
- 7055 Mango St
- 6792 Galveston Place
- 6886 Cabrini Ct
- 10456 Hamilton St
- 10851 Sonora Ave
- 10831 Sonora Ave
- 10844 Modoc St
- 10861 Sonora Ave
- 10827 Sonora Ave
- 10834 Modoc St
- 10854 Modoc St
- 6668 Fresno Ct
- 10824 Modoc St
- 10821 Sonora Ave
- 10871 Sonora Ave
- 10864 Modoc St
- 6662 Fresno Ct
- 10838 Sonora Ave
- 10814 Modoc St
- 10881 Sonora Ave
- 10830 Sonora Ave
- 10811 Sonora Ave
- 6669 Fresno Ct
- 10874 Modoc St