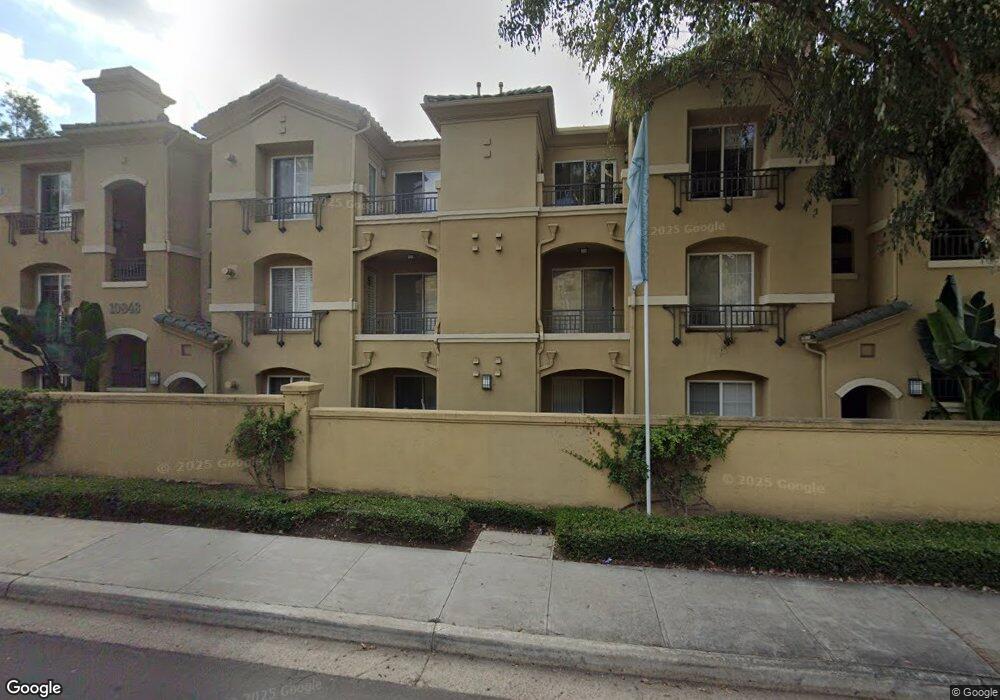
10848 Scripps Ranch Blvd Unit 208 San Diego, CA 92131
Scripps Ranch NeighborhoodEstimated Value: $697,432 - $745,000
2
Beds
2
Baths
1,201
Sq Ft
$605/Sq Ft
Est. Value
About This Home
This home is located at 10848 Scripps Ranch Blvd Unit 208, San Diego, CA 92131 and is currently estimated at $726,108, approximately $604 per square foot. 10848 Scripps Ranch Blvd Unit 208 is a home located in San Diego County with nearby schools including Miramar Ranch Elementary School, Thurgood Marshall Middle School, and Scripps Ranch High School.
Ownership History
Date
Name
Owned For
Owner Type
Purchase Details
Closed on
Dec 14, 2010
Sold by
Chao Bin and He Mingying
Bought by
Chao Bin and He Mingying
Current Estimated Value
Purchase Details
Closed on
Dec 7, 2009
Sold by
Federal Home Loan Mortgage Corporation
Bought by
He Ming Ying and Chao Bin
Purchase Details
Closed on
Sep 15, 2009
Sold by
Parhiala Erik and Parhiala Stacey Lynn
Bought by
Federal Home Loan Mortgage Corporation
Purchase Details
Closed on
Dec 13, 2006
Sold by
Scripps Llc
Bought by
Parhiala Erik and Parhiala Stacey Lynn
Home Financials for this Owner
Home Financials are based on the most recent Mortgage that was taken out on this home.
Original Mortgage
$315,920
Interest Rate
5.62%
Mortgage Type
New Conventional
Create a Home Valuation Report for This Property
The Home Valuation Report is an in-depth analysis detailing your home's value as well as a comparison with similar homes in the area
Home Values in the Area
Average Home Value in this Area
Purchase History
| Date | Buyer | Sale Price | Title Company |
|---|---|---|---|
| Chao Bin | -- | None Available | |
| He Ming Ying | $282,000 | First American Title Ins Co | |
| Federal Home Loan Mortgage Corporation | $275,000 | Landsafe Title | |
| Parhiala Erik | $395,000 | First American Title |
Source: Public Records
Mortgage History
| Date | Status | Borrower | Loan Amount |
|---|---|---|---|
| Previous Owner | Parhiala Erik | $315,920 |
Source: Public Records
Tax History Compared to Growth
Tax History
| Year | Tax Paid | Tax Assessment Tax Assessment Total Assessment is a certain percentage of the fair market value that is determined by local assessors to be the total taxable value of land and additions on the property. | Land | Improvement |
|---|---|---|---|---|
| 2025 | $4,436 | $363,997 | $193,616 | $170,381 |
| 2024 | $4,436 | $356,861 | $189,820 | $167,041 |
| 2023 | $4,338 | $349,865 | $186,099 | $163,766 |
| 2022 | $4,222 | $343,005 | $182,450 | $160,555 |
| 2021 | $4,192 | $336,280 | $178,873 | $157,407 |
| 2020 | $4,141 | $332,832 | $177,039 | $155,793 |
| 2019 | $4,068 | $326,307 | $173,568 | $152,739 |
| 2018 | $3,805 | $319,910 | $170,165 | $149,745 |
| 2017 | $3,714 | $313,638 | $166,829 | $146,809 |
| 2016 | $3,655 | $307,489 | $163,558 | $143,931 |
| 2015 | $3,601 | $302,872 | $161,102 | $141,770 |
| 2014 | $3,545 | $296,940 | $157,947 | $138,993 |
Source: Public Records
Map
Nearby Homes
- 11061 Scripps Ranch Blvd
- 10885 Scripps Ranch Blvd Unit 3
- 9939 Erma Rd Unit 101
- 9959 Erma Rd Unit 104
- 11856 Miro Cir
- 9899 Scripps Westview Way Unit 243
- 9899 Scripps Westview Way Unit 244
- 11115 Affinity Ct Unit 1
- 11825 Miro Cir
- 9909 Scripps Westview Way Unit 212
- 11175 Affinity Ct Unit 45
- 11235 Affinity Ct Unit 68
- 11325 Affinity Ct Unit 151
- 11265 Affinity Ct Unit 103
- 11215 Affinity Ct Unit 80
- 10771 Black Mountain Rd Unit 58
- 11365 Affinity Ct Unit 192
- 9960 Scripps Vista Way Unit 116
- 11091 Ice Skate Place Unit 20
- 9310 Galvin Ave Unit 15
- 10848 Scripps Ranch Blvd Unit 207
- 10832 Scripps Ranch Blvd Unit 105
- 10832 Scripps Ranch Blvd Unit 301
- 10832 Scripps Ranch Blvd Unit 303
- 10832 Scripps Ranch Blvd Unit 209
- 10848 Scripps Ranch Blvd Unit 13-301
- 10848 Scripps Ranch Blvd Unit 103
- 10848 Scripps Ranch Blvd Unit 206
- 10848 Scripps Ranch Blvd Unit 307
- 10848 Scripps Ranch Blvd Unit 205
- 10832 Scripps Ranch Blvd Unit 306
- 10848 Scripps Ranch Blvd Unit 302
- 10832 Scripps Ranch Blvd Unit 203
- 10848 Scripps Ranch Blvd Unit 201
- 10832 Scripps Ranch Blvd Unit 210
- 10832 Scripps Ranch Blvd Unit 201
- 10832 Scripps Ranch Blvd Unit 305
- 10848 Scripps Ranch Blvd Unit 105
- 10832 Scripps Ranch Blvd Unit 309
- 10848 Scripps Ranch Blvd Unit 101