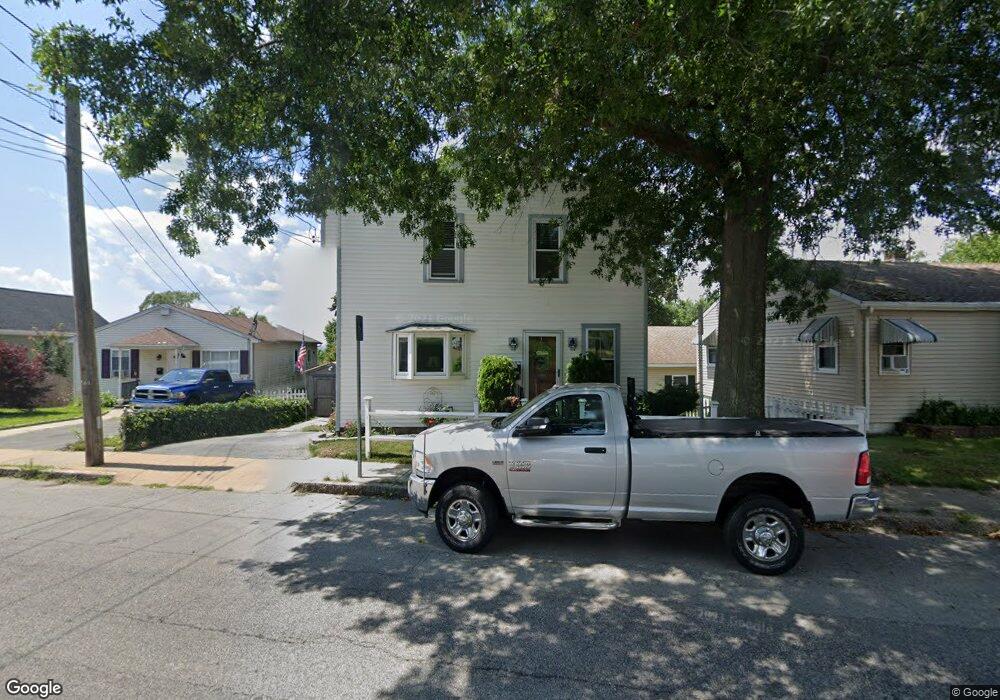
1085 Bay St Fall River, MA 02724
Sandy Beach NeighborhoodEstimated Value: $352,472 - $426,000
3
Beds
1
Bath
1,483
Sq Ft
$261/Sq Ft
Est. Value
About This Home
This home is located at 1085 Bay St, Fall River, MA 02724 and is currently estimated at $387,618, approximately $261 per square foot. 1085 Bay St is a home located in Bristol County with nearby schools including Carlton M. Viveiros Elementary School, Matthew J. Kuss Middle School, and B M C Durfee High School.
Ownership History
Date
Name
Owned For
Owner Type
Purchase Details
Closed on
Sep 24, 2025
Sold by
Viveiros Joseph R and Viveiros Valerie A
Bought by
Sevigny Deborah and Vieira Victor M
Current Estimated Value
Purchase Details
Closed on
May 15, 2000
Sold by
Fnma
Bought by
Viveiros Joseph R and Viveiros Valerie A
Purchase Details
Closed on
Mar 2, 2000
Sold by
Cory John M and Fnma
Bought by
Federal National Mortgage Association
Purchase Details
Closed on
Dec 15, 1989
Sold by
Somers Scott S
Bought by
Cory John M
Create a Home Valuation Report for This Property
The Home Valuation Report is an in-depth analysis detailing your home's value as well as a comparison with similar homes in the area
Home Values in the Area
Average Home Value in this Area
Purchase History
| Date | Buyer | Sale Price | Title Company |
|---|---|---|---|
| Sevigny Deborah | -- | -- | |
| Viveiros Joseph R | $103,000 | -- | |
| Federal National Mortgage Association | $105,000 | -- | |
| Cory John M | $123,500 | -- | |
| Cory John M | $123,500 | -- |
Source: Public Records
Mortgage History
| Date | Status | Borrower | Loan Amount |
|---|---|---|---|
| Previous Owner | Cory John M | $132,000 | |
| Previous Owner | Cory John M | $120,000 |
Source: Public Records
Tax History Compared to Growth
Tax History
| Year | Tax Paid | Tax Assessment Tax Assessment Total Assessment is a certain percentage of the fair market value that is determined by local assessors to be the total taxable value of land and additions on the property. | Land | Improvement |
|---|---|---|---|---|
| 2025 | $3,132 | $273,500 | $107,900 | $165,600 |
| 2024 | $2,929 | $254,900 | $103,900 | $151,000 |
| 2023 | $2,804 | $228,500 | $85,900 | $142,600 |
| 2022 | $2,521 | $199,800 | $81,800 | $118,000 |
| 2021 | $2,484 | $179,600 | $77,800 | $101,800 |
| 2020 | $2,481 | $171,700 | $76,700 | $95,000 |
| 2019 | $2,393 | $164,100 | $73,800 | $90,300 |
| 2018 | $2,382 | $162,900 | $80,000 | $82,900 |
| 2017 | $2,206 | $157,600 | $76,200 | $81,400 |
| 2016 | $2,145 | $157,400 | $81,100 | $76,300 |
| 2015 | $2,059 | $157,400 | $81,100 | $76,300 |
| 2014 | $1,950 | $155,000 | $78,700 | $76,300 |
Source: Public Records
Map
Nearby Homes
- 160 Foote St
- 289 King Philip St
- 321 King St
- 25 Winward St
- 27 Vista Way
- 24 Hall St
- 644-648 King Philip St
- 636-644 Dwelly St
- 123 Hall St
- 20 Wilcox St
- 616 Woodman St
- 31 Barker St
- 15 Higgins St
- 66 Bailey St
- 126 Wheeler St
- 584-586 Mount Hope Ave
- 1313 So Main St Unit 2
- 909 Dwelly St
- 1334 S Main St
- 11 Palmer St