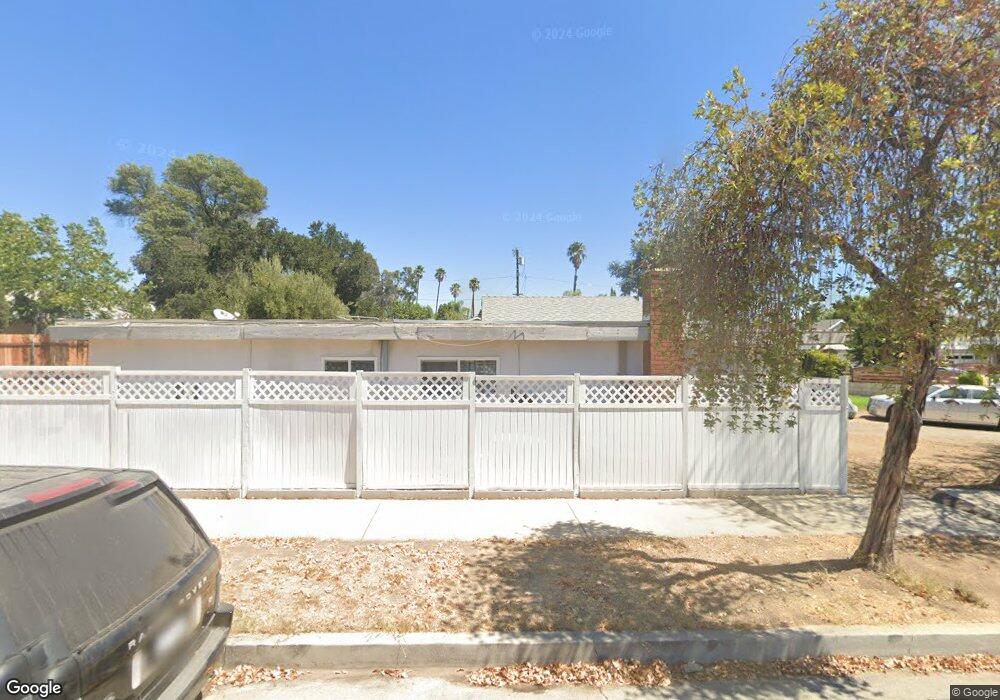
10852 Stanwin Ave Mission Hills, CA 91345
Estimated Value: $709,000 - $799,000
3
Beds
2
Baths
1,378
Sq Ft
$552/Sq Ft
Est. Value
About This Home
This home is located at 10852 Stanwin Ave, Mission Hills, CA 91345 and is currently estimated at $760,968, approximately $552 per square foot. 10852 Stanwin Ave is a home located in Los Angeles County with nearby schools including San Jose Street Elementary School, George K. Porter Middle School, and John F. Kennedy High School.
Ownership History
Date
Name
Owned For
Owner Type
Purchase Details
Closed on
Dec 7, 1999
Sold by
Saenz Celia
Bought by
Pitt Joseph
Current Estimated Value
Purchase Details
Closed on
Sep 23, 1999
Sold by
Pitt Joseph J
Bought by
Saenz Celia
Home Financials for this Owner
Home Financials are based on the most recent Mortgage that was taken out on this home.
Original Mortgage
$174,561
Interest Rate
7.97%
Mortgage Type
FHA
Purchase Details
Closed on
Aug 31, 1999
Sold by
Venture Investment Properties Llc
Bought by
Pitt Joseph and Saenz Celia
Home Financials for this Owner
Home Financials are based on the most recent Mortgage that was taken out on this home.
Original Mortgage
$174,561
Interest Rate
7.97%
Mortgage Type
FHA
Purchase Details
Closed on
Mar 29, 1999
Sold by
Sanchez Carlos
Bought by
Venture Investment Properties
Create a Home Valuation Report for This Property
The Home Valuation Report is an in-depth analysis detailing your home's value as well as a comparison with similar homes in the area
Home Values in the Area
Average Home Value in this Area
Purchase History
| Date | Buyer | Sale Price | Title Company |
|---|---|---|---|
| Pitt Joseph | -- | -- | |
| Saenz Celia | -- | American Title Co | |
| Pitt Joseph | $176,000 | American Title Co | |
| Venture Investment Properties | $121,500 | Old Republic Title |
Source: Public Records
Mortgage History
| Date | Status | Borrower | Loan Amount |
|---|---|---|---|
| Previous Owner | Pitt Joseph | $174,561 |
Source: Public Records
Tax History
| Year | Tax Paid | Tax Assessment Tax Assessment Total Assessment is a certain percentage of the fair market value that is determined by local assessors to be the total taxable value of land and additions on the property. | Land | Improvement |
|---|---|---|---|---|
| 2025 | $3,461 | $270,483 | $130,939 | $139,544 |
| 2024 | $3,461 | $265,180 | $128,372 | $136,808 |
| 2023 | $3,398 | $259,981 | $125,855 | $134,126 |
| 2022 | $3,247 | $254,885 | $123,388 | $131,497 |
| 2021 | $3,202 | $249,888 | $120,969 | $128,919 |
| 2019 | $3,109 | $242,479 | $117,382 | $125,097 |
| 2018 | $2,992 | $237,726 | $115,081 | $122,645 |
| 2016 | $2,848 | $228,497 | $110,613 | $117,884 |
| 2015 | $2,807 | $225,066 | $108,952 | $116,114 |
| 2014 | $2,824 | $220,658 | $106,818 | $113,840 |
Source: Public Records
Map
Nearby Homes
- 14746 Jaguar St
- 10864 Wolcott Place
- 14519 Fox St
- 10961 Sharp Ave
- 11068 Sharp Ave Unit H
- 15047 Chatsworth St Unit 7
- 14662 Maclay St
- 10544 Stanwin Ave
- 14655 Maclay St
- 10959 Memory Park Ave
- 10943 Laurel Canyon Unit A6
- 14763 San Fernando Mission Blvd
- 11225 Acala Ave
- 10901 Laurel Canyon Blvd Unit 108
- 10901 Laurel Canyon Blvd Unit 212
- 10901 Laurel Canyon Blvd
- 2 Donna Way
- 25 Katy Ln
- 11419 Acala Ave
- 18 Portola Rd
- 10848 Stanwin Ave
- 10858 Stanwin Ave
- 10868 Stanwin Ave
- 10844 Stanwin Ave
- 10913 Arleta Ave
- 10907 Arleta Ave
- 10919 Arleta Ave
- 10904 Stanwin Ave
- 10836 Stanwin Ave
- 10901 Arleta Ave
- 10842 Stanwin Ave
- 10883 Arleta Ave
- 10840 Stanwin Ave
- 10925 Arleta Ave
- 10877 Arleta Ave
- 10912 Stanwin Ave
- 14683 Fox St
- 10935 Arleta Ave
- 14667 Fox St
- 14661 Fox St
Your Personal Tour Guide
Ask me questions while you tour the home.