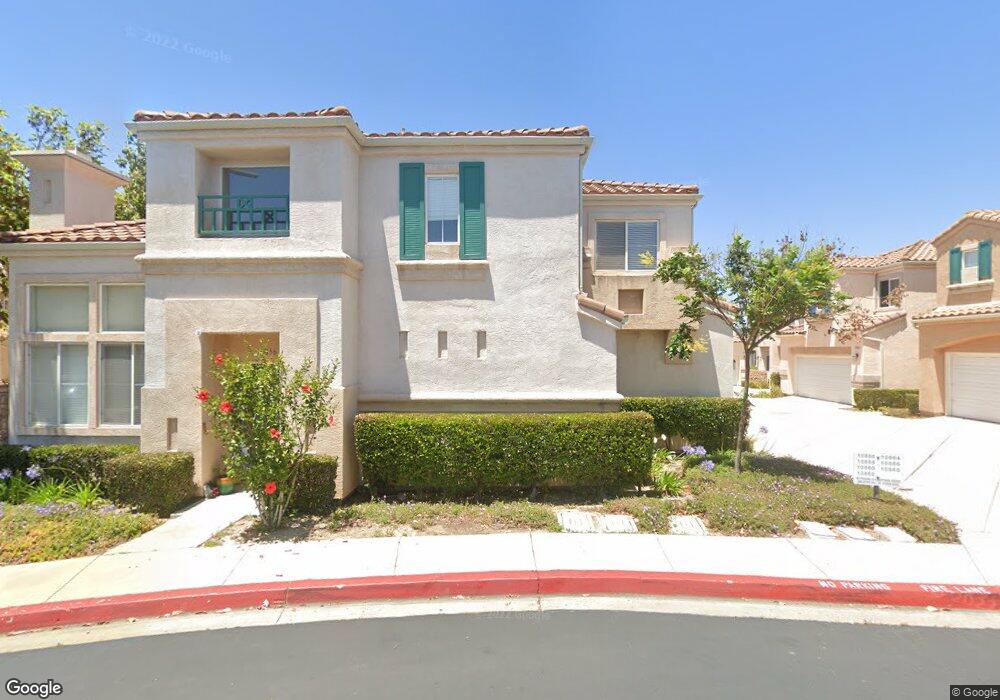
10860 Caminito Arcada Unit 150 San Diego, CA 92131
Miramar Ranch North NeighborhoodEstimated Value: $998,000 - $1,073,000
4
Beds
3
Baths
1,600
Sq Ft
$641/Sq Ft
Est. Value
About This Home
This home is located at 10860 Caminito Arcada Unit 150, San Diego, CA 92131 and is currently estimated at $1,025,078, approximately $640 per square foot. 10860 Caminito Arcada Unit 150 is a home located in San Diego County with nearby schools including Dingeman Elementary School, Thurgood Marshall Middle School, and Scripps Ranch High School.
Ownership History
Date
Name
Owned For
Owner Type
Purchase Details
Closed on
Jul 18, 2020
Sold by
Cat Yang and Shaw Peter
Bought by
Shaw Peter X and Cai Yang
Current Estimated Value
Purchase Details
Closed on
Jan 4, 2013
Sold by
Shaw Peter X
Bought by
Shaw Peter X and Cai Daisy Yang
Home Financials for this Owner
Home Financials are based on the most recent Mortgage that was taken out on this home.
Original Mortgage
$198,000
Outstanding Balance
$36,105
Interest Rate
2.61%
Mortgage Type
New Conventional
Estimated Equity
$988,973
Purchase Details
Closed on
Oct 8, 1997
Sold by
Encore Scripps Ranch Lp
Bought by
Shaw Peter X and Cai Daisy Yang
Home Financials for this Owner
Home Financials are based on the most recent Mortgage that was taken out on this home.
Original Mortgage
$159,900
Interest Rate
6.87%
Create a Home Valuation Report for This Property
The Home Valuation Report is an in-depth analysis detailing your home's value as well as a comparison with similar homes in the area
Home Values in the Area
Average Home Value in this Area
Purchase History
| Date | Buyer | Sale Price | Title Company |
|---|---|---|---|
| Shaw Peter X | -- | None Available | |
| Shaw Peter X | -- | Accommodation | |
| Shaw Peter X | -- | First American Title Company | |
| Shaw Peter X | $200,000 | First American Title |
Source: Public Records
Mortgage History
| Date | Status | Borrower | Loan Amount |
|---|---|---|---|
| Open | Shaw Peter X | $198,000 | |
| Previous Owner | Shaw Peter X | $159,900 |
Source: Public Records
Tax History Compared to Growth
Tax History
| Year | Tax Paid | Tax Assessment Tax Assessment Total Assessment is a certain percentage of the fair market value that is determined by local assessors to be the total taxable value of land and additions on the property. | Land | Improvement |
|---|---|---|---|---|
| 2025 | $4,057 | $319,162 | $103,774 | $215,388 |
| 2024 | $4,057 | $312,905 | $101,740 | $211,165 |
| 2023 | $3,959 | $306,771 | $99,746 | $207,025 |
| 2022 | $3,808 | $300,757 | $97,791 | $202,966 |
| 2021 | $3,772 | $294,861 | $95,874 | $198,987 |
| 2020 | $3,728 | $291,838 | $94,891 | $196,947 |
| 2019 | $3,917 | $286,117 | $93,031 | $193,086 |
| 2018 | $4,270 | $280,507 | $91,207 | $189,300 |
| 2017 | $80 | $275,008 | $89,419 | $185,589 |
| 2016 | $4,151 | $269,616 | $87,666 | $181,950 |
| 2015 | $4,103 | $265,567 | $86,350 | $179,217 |
| 2014 | $4,047 | $260,366 | $84,659 | $175,707 |
Source: Public Records
Map
Nearby Homes
- 10818 Caminito Arcada
- 10914 Ivy Hill Dr Unit 1
- 10941 Waterton Rd
- 11629 Swan Lake Dr Unit 4
- 12490 Heatherton Ct Unit 8
- 12530 Heatherton Ct Unit 31
- 11121 Catarina Ln Unit 73
- 10978 Serafina Ln Unit 69
- 12665 Creekview Dr Unit 140
- 12626 Springbrook Dr Unit A
- 12662 Springbrook Dr Unit D
- 12670 Springbrook Dr Unit D
- 10804 Serafina Ln Unit 6
- 11482 Cortina Place
- 12676 Springbrook Dr Unit B
- 11793 Alderhill Terrace
- 11365 Affinity Ct Unit 192
- 9819 Kika Ct
- 11553 Trailbrook Ln Unit 2
- 11215 Affinity Ct Unit 80
- 10858 Caminito Arcada
- 10862 Caminito Arcada
- 10856 Caminito Arcada
- 10866 Caminito Arcada
- 10850 Caminito Arcada
- 10864 Caminito Arcada
- 10868 Caminito Arcada
- 10852 Caminito Arcada
- 10846 Caminito Arcada
- 10842 Caminito Arcada Unit 142
- 10848 Caminito Arcada
- 10844 Caminito Arcada
- 10838 Caminito Arcada
- 10886 Caminito Arcada Unit 158
- 10870 Caminito Arcada
- 10882 Caminito Arcada
- 10892 Caminito Arcada
- 10884 Caminito Arcada
- 10880 Caminito Arcada
- 10840 Caminito Arcada