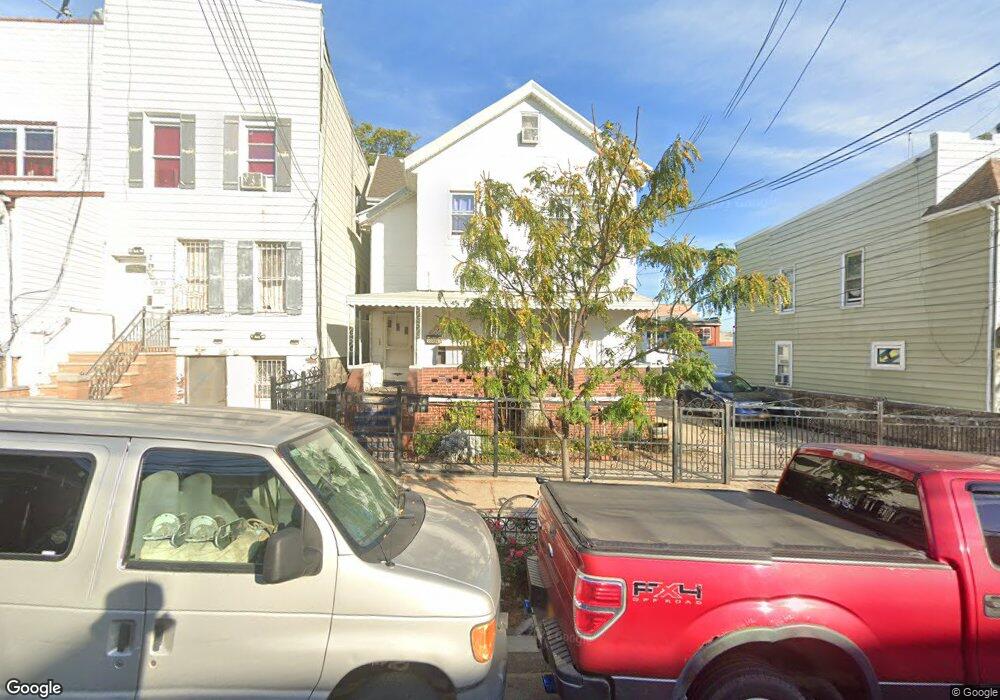
10861 50th Ave Flushing, NY 11368
Corona NeighborhoodEstimated Value: $1,433,042
--
Bed
--
Bath
2,388
Sq Ft
$600/Sq Ft
Est. Value
About This Home
This home is located at 10861 50th Ave, Flushing, NY 11368 and is currently estimated at $1,433,042, approximately $600 per square foot. 10861 50th Ave is a home located in Queens County with nearby schools including Is 61 Leonardo Da Vinci, John Bowne High School, and St. Leo Elementary School.
Ownership History
Date
Name
Owned For
Owner Type
Purchase Details
Closed on
May 23, 2019
Sold by
Sanaycela Ezequiel
Bought by
Sanaycela Beatriz A and Sanaycela Ezequiel
Current Estimated Value
Purchase Details
Closed on
Sep 7, 2004
Sold by
Carchi Jose R
Bought by
Ezequiel Sanaycela
Home Financials for this Owner
Home Financials are based on the most recent Mortgage that was taken out on this home.
Original Mortgage
$600,000
Interest Rate
5.89%
Mortgage Type
Commercial
Purchase Details
Closed on
May 16, 2002
Sold by
Ferrero Oscar and Ferrero Nilda
Bought by
Carchi Jose J
Home Financials for this Owner
Home Financials are based on the most recent Mortgage that was taken out on this home.
Original Mortgage
$405,600
Interest Rate
6.27%
Mortgage Type
Commercial
Create a Home Valuation Report for This Property
The Home Valuation Report is an in-depth analysis detailing your home's value as well as a comparison with similar homes in the area
Home Values in the Area
Average Home Value in this Area
Purchase History
| Date | Buyer | Sale Price | Title Company |
|---|---|---|---|
| Sanaycela Beatriz A | -- | -- | |
| Ezequiel Sanaycela | $750,000 | -- | |
| Ezequiel Sanaycela | $750,000 | -- | |
| Carchi Jose J | -- | -- | |
| Carchi Jose J | -- | -- |
Source: Public Records
Mortgage History
| Date | Status | Borrower | Loan Amount |
|---|---|---|---|
| Previous Owner | Ezequiel Sanaycela | $75,000 | |
| Previous Owner | Ezequiel Sanaycela | $600,000 | |
| Previous Owner | Carchi Jose J | $405,600 |
Source: Public Records
Tax History Compared to Growth
Tax History
| Year | Tax Paid | Tax Assessment Tax Assessment Total Assessment is a certain percentage of the fair market value that is determined by local assessors to be the total taxable value of land and additions on the property. | Land | Improvement |
|---|---|---|---|---|
| 2025 | $9,120 | $78,785 | $1,129 | $77,656 |
| 2024 | $9,120 | $72,950 | $1,210 | $71,740 |
| 2023 | $8,445 | $67,551 | $1,042 | $66,509 |
| 2022 | $8,265 | $297,450 | $4,500 | $292,950 |
| 2021 | $8,029 | $247,050 | $4,500 | $242,550 |
| 2020 | $7,559 | $269,550 | $4,500 | $265,050 |
| 2019 | $7,077 | $245,250 | $4,500 | $240,750 |
| 2018 | $6,609 | $51,962 | $1,137 | $50,825 |
| 2017 | $6,609 | $51,962 | $1,325 | $50,637 |
| 2016 | $6,491 | $51,962 | $1,325 | $50,637 |
| 2015 | $4,027 | $46,619 | $1,105 | $45,514 |
| 2014 | $4,027 | $43,166 | $1,202 | $41,964 |
Source: Public Records
Map
Nearby Homes
- 5008 111th St
- 49-12 111th St
- 49-10 111th St Unit 3A
- 108-42 51st Ave
- 108-51 52nd Ave
- 49-08 111th St Unit 4B
- 10831 50th Ave Unit 3A
- 10827 50th Ave
- 10855 48th Ave
- 108-25 48th Ave
- 108-19 48th Ave
- 54-14 111th St
- 110-25 55th Ave
- 11021 55th Ave
- 104-73 48th Ave
- 10464 48th Ave
- 5409 108th St Unit 6A
- 106-16 Corona Ave
- 10605 49th Ave
- 10603 49th Ave
- 10859 50th Ave
- 108-59 50th Ave
- 10857 50th Ave
- 10867 50th Ave
- 10855 50th Ave
- 10869 50th Ave
- 10869 50th Ave
- 10853 50th Ave
- 108-53 50th Ave
- 10851 50th Ave
- 10862 49th Ave
- 10864 49th Ave
- 10860 49th Ave
- 10868 49th Ave
- 10858 49th Ave
- 108-62 49th Ave
- 108-62 49th Ave Unit 2
- 108-70 49th Ave
- 108-70 49th Ave
- 10860 49th Ave