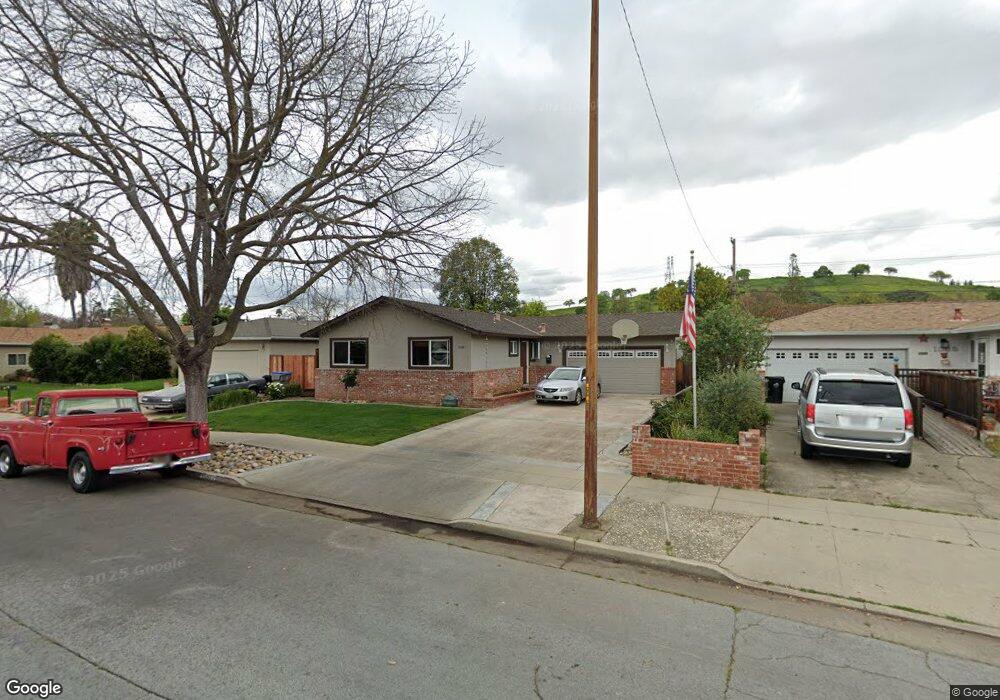
1087 Cloverbrook Dr San Jose, CA 95120
Sunrise Almaden NeighborhoodEstimated Value: $1,406,693 - $1,749,000
3
Beds
2
Baths
1,104
Sq Ft
$1,410/Sq Ft
Est. Value
About This Home
This home is located at 1087 Cloverbrook Dr, San Jose, CA 95120 and is currently estimated at $1,556,423, approximately $1,409 per square foot. 1087 Cloverbrook Dr is a home located in Santa Clara County with nearby schools including Simonds Elementary School, Castillero Middle School, and Leland High School.
Ownership History
Date
Name
Owned For
Owner Type
Purchase Details
Closed on
Jan 29, 2013
Sold by
Spalinger Gloria A
Bought by
Spalinger Gloria A
Current Estimated Value
Purchase Details
Closed on
Sep 1, 2011
Sold by
Smith James A and Spalinger Gloria A
Bought by
Smith James A and Spalinger Gloria A
Purchase Details
Closed on
Oct 5, 2004
Sold by
Zourbakhsh Reza
Bought by
Smith James A and Spalinger Gloria A
Purchase Details
Closed on
May 9, 2002
Sold by
Benedetti Richard E and Benedetti Janet L
Bought by
Zourbakhsh Reza
Home Financials for this Owner
Home Financials are based on the most recent Mortgage that was taken out on this home.
Original Mortgage
$437,400
Interest Rate
7.5%
Purchase Details
Closed on
Jul 5, 1996
Sold by
Neville Brent and Neville Monica
Bought by
Benedetti Richard E and Benedetti Janet L
Home Financials for this Owner
Home Financials are based on the most recent Mortgage that was taken out on this home.
Original Mortgage
$198,900
Interest Rate
8.03%
Create a Home Valuation Report for This Property
The Home Valuation Report is an in-depth analysis detailing your home's value as well as a comparison with similar homes in the area
Home Values in the Area
Average Home Value in this Area
Purchase History
| Date | Buyer | Sale Price | Title Company |
|---|---|---|---|
| Spalinger Gloria A | -- | None Available | |
| Smith James A | -- | None Available | |
| Smith James A | $630,000 | Chicago Title | |
| Zourbakhsh Reza | $486,000 | Chicago Title Co | |
| Benedetti Richard E | $221,000 | Fidelity National Title Co |
Source: Public Records
Mortgage History
| Date | Status | Borrower | Loan Amount |
|---|---|---|---|
| Previous Owner | Zourbakhsh Reza | $437,400 | |
| Previous Owner | Benedetti Richard E | $198,900 |
Source: Public Records
Tax History Compared to Growth
Tax History
| Year | Tax Paid | Tax Assessment Tax Assessment Total Assessment is a certain percentage of the fair market value that is determined by local assessors to be the total taxable value of land and additions on the property. | Land | Improvement |
|---|---|---|---|---|
| 2025 | $11,551 | $878,077 | $482,841 | $395,236 |
| 2024 | $11,551 | $860,861 | $473,374 | $387,487 |
| 2023 | $11,325 | $843,983 | $464,093 | $379,890 |
| 2022 | $11,217 | $827,436 | $454,994 | $372,442 |
| 2021 | $10,978 | $811,213 | $446,073 | $365,140 |
| 2020 | $10,726 | $802,896 | $441,500 | $361,396 |
| 2019 | $10,434 | $787,154 | $432,844 | $354,310 |
| 2018 | $10,329 | $771,720 | $424,357 | $347,363 |
| 2017 | $10,245 | $756,589 | $416,037 | $340,552 |
| 2016 | $10,061 | $741,755 | $407,880 | $333,875 |
| 2015 | $9,995 | $730,614 | $401,754 | $328,860 |
| 2014 | $9,539 | $716,304 | $393,885 | $322,419 |
Source: Public Records
Map
Nearby Homes
- 6384 Farm Hill Way
- 1101 Culligan Blvd
- 6421 Montana Ct
- 0 Oak Glen Rd Unit IG25104733
- 6107 Oak Forest Way
- 6579 Cooperage Ct
- 6407 Berwickshire Way
- 1288 Rio Hondo Dr
- 6628 Wildwood Ct
- 1122 Hearth Ct
- 1174 Old Oak Dr
- 6445 Gondola Way
- 1204 La Terrace Cir Unit 339
- 1278 Poker Flat Place
- 6144 Mancuso St
- 2014 La Terrace Cir
- 2004 La Terrace Cir
- 1913 La Terrace Cir
- 6015 Fernglen Dr
- 1513 La Terrace Cir Unit 282
- 1089 Cloverbrook Dr
- 1085 Cloverbrook Dr
- 1070 Wallace Dr
- 1072 Wallace Dr
- 1068 Wallace Dr
- 1091 Cloverbrook Dr
- 1083 Cloverbrook Dr
- 1074 Wallace Dr
- 1064 Wallace Dr
- 1084 Cloverbrook Dr
- 1093 Cloverbrook Dr
- 1081 Cloverbrook Dr
- 1078 Wallace Dr
- 1062 Wallace Dr
- 6329 Farm Hill Way
- 1082 Cloverbrook Dr
- 6331 Farm Hill Way
- 1080 Wallace Dr
- 1079 Cloverbrook Dr
- 1060 Wallace Dr