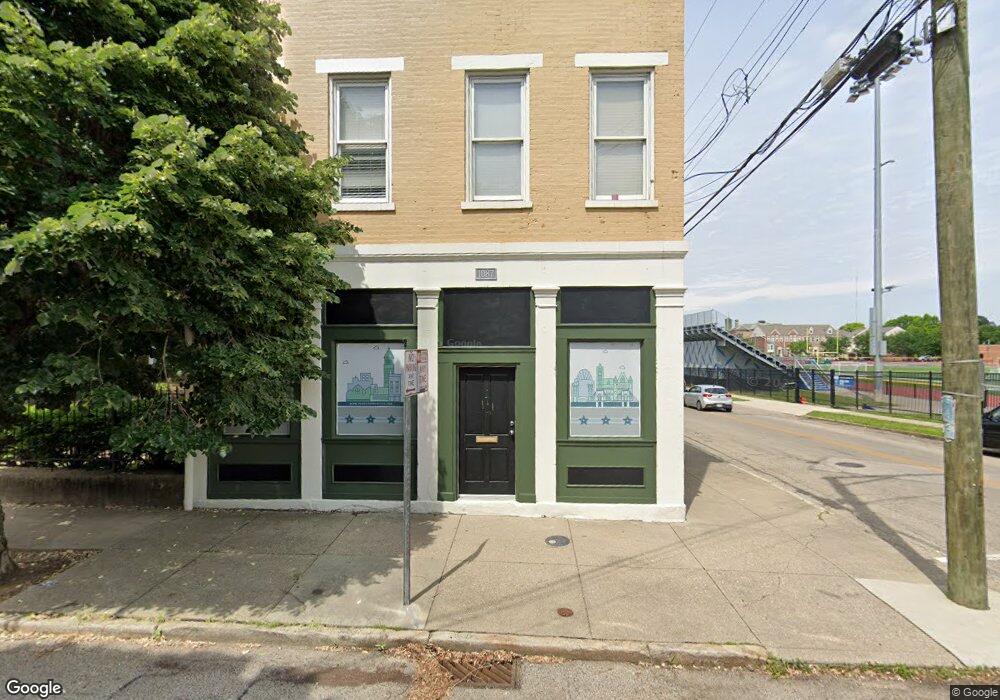
1087 Mound St Cincinnati, OH 45203
West End NeighborhoodEstimated Value: $140,668
8
Beds
4
Baths
4,356
Sq Ft
$32/Sq Ft
Est. Value
About This Home
This home is located at 1087 Mound St, Cincinnati, OH 45203 and is currently estimated at $140,668, approximately $32 per square foot. 1087 Mound St is a home located in Hamilton County with nearby schools including Hays-Porter School, Robert A. Taft Information Technology High School, and Gilbert A. Dater High School.
Ownership History
Date
Name
Owned For
Owner Type
Purchase Details
Closed on
Aug 1, 2012
Sold by
The Model Group Inc
Bought by
Keidel Barry
Current Estimated Value
Home Financials for this Owner
Home Financials are based on the most recent Mortgage that was taken out on this home.
Original Mortgage
$10,700,000
Outstanding Balance
$3,579,058
Interest Rate
3.54%
Mortgage Type
Future Advance Clause Open End Mortgage
Estimated Equity
-$3,438,390
Purchase Details
Closed on
Feb 28, 2007
Sold by
1087 Mound Street Associates
Bought by
Reckman Inc
Create a Home Valuation Report for This Property
The Home Valuation Report is an in-depth analysis detailing your home's value as well as a comparison with similar homes in the area
Home Values in the Area
Average Home Value in this Area
Purchase History
| Date | Buyer | Sale Price | Title Company |
|---|---|---|---|
| Keidel Barry | $57,310 | Attorney | |
| Reckman Inc | -- | None Available |
Source: Public Records
Mortgage History
| Date | Status | Borrower | Loan Amount |
|---|---|---|---|
| Open | Keidel Barry | $10,700,000 |
Source: Public Records
Tax History
| Year | Tax Paid | Tax Assessment Tax Assessment Total Assessment is a certain percentage of the fair market value that is determined by local assessors to be the total taxable value of land and additions on the property. | Land | Improvement |
|---|---|---|---|---|
| 2025 | $650 | $7,413 | $2,800 | $4,613 |
| 2023 | $2,541 | $30,531 | $2,961 | $27,570 |
| 2022 | $2,731 | $29,764 | $3,220 | $26,544 |
| 2021 | $2,673 | $29,764 | $3,220 | $26,544 |
| 2020 | $2,674 | $29,764 | $3,220 | $26,544 |
| 2019 | $2,321 | $23,811 | $2,576 | $21,235 |
| 2018 | $2,322 | $23,811 | $2,576 | $21,235 |
| 2017 | $2,248 | $23,811 | $2,576 | $21,235 |
| 2016 | $2,078 | $21,554 | $2,692 | $18,862 |
Source: Public Records
Map
Nearby Homes
Your Personal Tour Guide
Ask me questions while you tour the home.