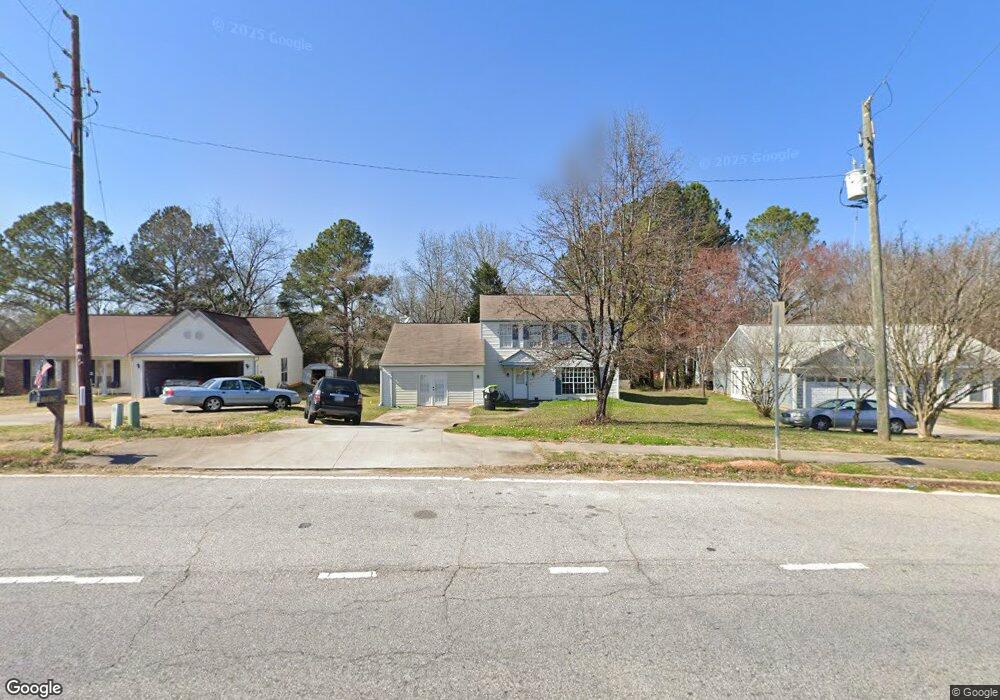
10879 Panhandle Rd Hampton, GA 30228
Estimated Value: $209,038 - $246,000
3
Beds
3
Baths
1,650
Sq Ft
$134/Sq Ft
Est. Value
About This Home
This home is located at 10879 Panhandle Rd, Hampton, GA 30228 and is currently estimated at $221,260, approximately $134 per square foot. 10879 Panhandle Rd is a home located in Clayton County with nearby schools including Kemp Primary School, Kemp Elementary School, and Eddie White Academy.
Ownership History
Date
Name
Owned For
Owner Type
Purchase Details
Closed on
Jun 16, 2011
Sold by
Hud-Housing Of Urban Dev
Bought by
Jones Kela M
Current Estimated Value
Purchase Details
Closed on
Aug 3, 2010
Sold by
Branch Bkng & Trust Co
Bought by
Hud-Housing Of Urban Dev
Purchase Details
Closed on
Feb 6, 2007
Sold by
Bryant Norman and Bryant Nicole
Bought by
Cook Antonio A
Home Financials for this Owner
Home Financials are based on the most recent Mortgage that was taken out on this home.
Original Mortgage
$95,000
Interest Rate
10.45%
Mortgage Type
New Conventional
Purchase Details
Closed on
Apr 28, 1999
Sold by
Martin Darrell F and Martin Lenita
Bought by
Bryant Norman
Home Financials for this Owner
Home Financials are based on the most recent Mortgage that was taken out on this home.
Original Mortgage
$96,800
Interest Rate
7%
Mortgage Type
FHA
Create a Home Valuation Report for This Property
The Home Valuation Report is an in-depth analysis detailing your home's value as well as a comparison with similar homes in the area
Home Values in the Area
Average Home Value in this Area
Purchase History
| Date | Buyer | Sale Price | Title Company |
|---|---|---|---|
| Jones Kela M | -- | -- | |
| Hud-Housing Of Urban Dev | -- | -- | |
| Branch Bkng & Trust Co | $138,669 | -- | |
| Cook Antonio A | $95,000 | -- | |
| Bryant Norman | $97,700 | -- |
Source: Public Records
Mortgage History
| Date | Status | Borrower | Loan Amount |
|---|---|---|---|
| Previous Owner | Cook Antonio A | $95,000 | |
| Previous Owner | Bryant Norman | $96,800 |
Source: Public Records
Tax History
| Year | Tax Paid | Tax Assessment Tax Assessment Total Assessment is a certain percentage of the fair market value that is determined by local assessors to be the total taxable value of land and additions on the property. | Land | Improvement |
|---|---|---|---|---|
| 2025 | $10,074 | $77,560 | $8,000 | $69,560 |
| 2024 | $2,836 | $71,720 | $8,000 | $63,720 |
| 2023 | $5,017 | $63,400 | $8,000 | $55,400 |
| 2022 | $2,777 | $69,800 | $8,000 | $61,800 |
| 2021 | $2,038 | $50,640 | $8,000 | $42,640 |
| 2020 | $1,868 | $45,765 | $8,000 | $37,765 |
| 2019 | $1,672 | $40,256 | $6,400 | $33,856 |
| 2018 | $1,424 | $34,148 | $6,400 | $27,748 |
| 2017 | $1,465 | $35,075 | $6,400 | $28,675 |
| 2016 | $1,142 | $27,120 | $6,400 | $20,720 |
| 2015 | $1,133 | $0 | $0 | $0 |
| 2014 | $1,148 | $27,902 | $6,400 | $21,502 |
Source: Public Records
Map
Nearby Homes
- 1350 Birdsong Ln
- 10897 Paladin Dr
- 1432 Shadow Creek Ave
- 1278 Lynx Ct
- 1578 Pintail Rd
- 11146 Shadow Creek Terrace
- 1500 Mine Run
- 1380 Pebble Beach Ln Unit 2
- 11059 Sedalia Way
- 1620 Amelia Ct
- 10664 Sandpiper Rd
- 1661 Louisa Ct
- 10747 Thrasher Rd
- 1605 Plover Rd
- 10571 Starling Trail Unit II
- 1443 Pebble Ridge Ln
- 11005 Regents Ct
- 10990 Clearwater Dr
- 10996 Shannon Cir
- 1469 Glynn View Ct
- 10873 Panhandle Rd
- 10881 Panhandle Rd
- 10858 Morning Dove Ct
- 10858 Morning Dove Dr
- 10864 Morning Dove Ct
- 10864 Morning Dove Ct Unit 3
- 10867 Panhandle Rd
- 10852 Morning Dove Ct Unit 2
- 10870 Morning Dove Ct
- 10870 Morning Dove Ct
- 1395 Foxvale Dr
- 10844 Morning Dove Ct
- 1389 Foxvale Dr Unit 2
- 1383 Foxvale Dr
- 10859 Morning Dove Ct
- 10859 Morning Dove Dr
- 1377 Foxvale Dr
- 10867 Morning Dove Ct
- 10843 Morning Dove Ct
- 10847 Morning Dove Ct
Your Personal Tour Guide
Ask me questions while you tour the home.