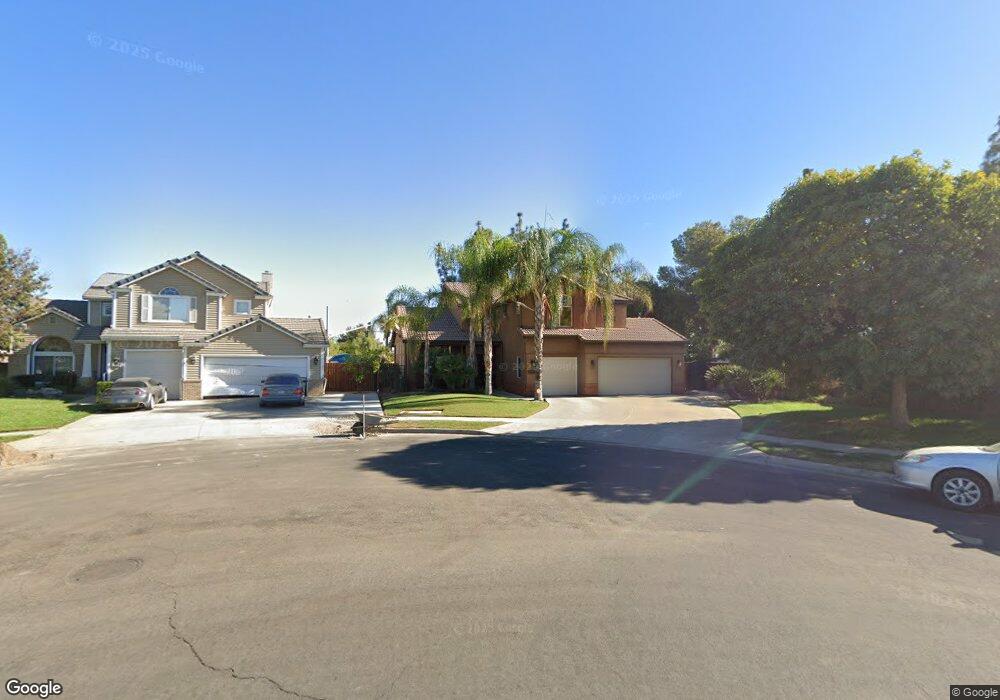
1088 Kensington Ave Lemoore, CA 93245
Estimated Value: $485,000 - $521,000
4
Beds
3
Baths
2,364
Sq Ft
$213/Sq Ft
Est. Value
About This Home
This home is located at 1088 Kensington Ave, Lemoore, CA 93245 and is currently estimated at $502,978, approximately $212 per square foot. 1088 Kensington Ave is a home located in Kings County with nearby schools including Cinnamon Elementary School, Liberty Middle School, and Lemoore High School.
Ownership History
Date
Name
Owned For
Owner Type
Purchase Details
Closed on
Aug 28, 2024
Sold by
Tamayo Jose T
Bought by
Tamayo Olivia N
Current Estimated Value
Purchase Details
Closed on
Apr 26, 2018
Sold by
Tamayo Olivia N
Bought by
Tamayo Jose T
Purchase Details
Closed on
Apr 25, 2018
Sold by
Tamayo Olivia N
Bought by
Tamayo Jose T
Purchase Details
Closed on
May 26, 2011
Sold by
Tamayo Maximino
Bought by
Tamayo Olivia N
Purchase Details
Closed on
May 25, 2011
Sold by
Onewest Bank Fsb
Bought by
Tamayo Olivia N
Purchase Details
Closed on
Mar 2, 2011
Sold by
Rosario Virgilio A and Rosario Relita P
Bought by
Onewest Bank Fsb
Create a Home Valuation Report for This Property
The Home Valuation Report is an in-depth analysis detailing your home's value as well as a comparison with similar homes in the area
Home Values in the Area
Average Home Value in this Area
Purchase History
| Date | Buyer | Sale Price | Title Company |
|---|---|---|---|
| Tamayo Olivia N | -- | None Listed On Document | |
| Tamayo Jose T | -- | None Listed On Document | |
| Tamayo Jose T | -- | None Listed On Document | |
| Tamayo Olivia N | -- | Lsi Title Company Ca | |
| Tamayo Olivia N | $200,000 | Lsi Title Company Ca | |
| Onewest Bank Fsb | $202,123 | Accommodation |
Source: Public Records
Tax History Compared to Growth
Tax History
| Year | Tax Paid | Tax Assessment Tax Assessment Total Assessment is a certain percentage of the fair market value that is determined by local assessors to be the total taxable value of land and additions on the property. | Land | Improvement |
|---|---|---|---|---|
| 2025 | $3,206 | $460,000 | $85,000 | $375,000 |
| 2023 | $3,206 | $290,953 | $78,472 | $212,481 |
| 2022 | $3,357 | $285,249 | $76,934 | $208,315 |
| 2021 | $3,277 | $279,657 | $75,426 | $204,231 |
| 2020 | $3,260 | $276,790 | $74,653 | $202,137 |
| 2019 | $3,235 | $271,363 | $73,189 | $198,174 |
| 2018 | $3,048 | $266,042 | $71,754 | $194,288 |
| 2017 | $3,055 | $260,825 | $70,347 | $190,478 |
| 2016 | $2,881 | $255,711 | $68,968 | $186,743 |
| 2015 | $2,794 | $251,870 | $67,932 | $183,938 |
| 2014 | $2,715 | $246,936 | $66,601 | $180,335 |
Source: Public Records
Map
Nearby Homes
- 233 W Spring Ln
- 272 W Burlwood Ln
- 631 Brentwood Dr
- 414 W Hanford Armona Rd Unit F 13
- 414 W Hanford Armona Rd
- 73 Devon Dr
- 137 W Spruce Ave
- 252 W Deodar Ln
- 83 W Deodar Ln
- 334 G St Unit X
- 342 G Aly Units X&y
- 108 W Deodar Ln
- 142 G St
- 982 Freedom Dr
- 17 G St
- 231 E St
- 651 Wood Ln
- 530 E Spruce Ave
- 840 Daphne Ln
- 752 Olympic Ave
- 284 Avalon Dr
- 1074 Kensington Ave
- 300 Avalon Dr
- 1060 Kensington Ave
- 1065 Kensington Ave
- 316 Avalon Dr
- 1046 Kensington Ave
- 1051 Kensington Ave
- 332 Avalon Dr
- 1101 Antelope Dr
- 1037 Kensington Ave
- 296 W Hanford Armona Rd
- 236 W Hanford Armona Rd
- 1052 Hanover Ave
- 1032 Kensington Ave
- 348 Avalon Dr
- 1023 Kensington Ave
- 348 W Hanford Armona Rd
- 314 W Hanford Armona Rd
- 1036 Hanover Ave