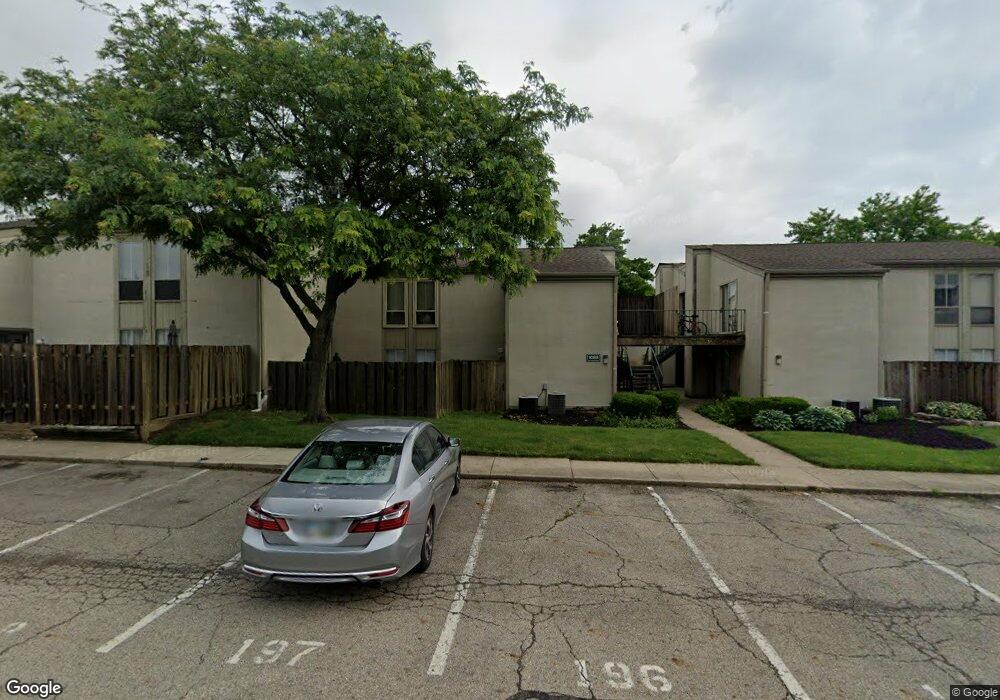
1088 Merrimar Cir S Unit 1088D Columbus, OH 43220
Governours Square NeighborhoodEstimated Value: $144,000 - $154,000
2
Beds
1
Bath
874
Sq Ft
$170/Sq Ft
Est. Value
About This Home
This home is located at 1088 Merrimar Cir S Unit 1088D, Columbus, OH 43220 and is currently estimated at $148,338, approximately $169 per square foot. 1088 Merrimar Cir S Unit 1088D is a home located in Franklin County with nearby schools including Winterset Elementary School, Ridgeview Middle School, and Centennial High School.
Ownership History
Date
Name
Owned For
Owner Type
Purchase Details
Closed on
Dec 5, 2022
Sold by
Lane Brandon
Bought by
Ryan Jennifer G and Ryan Phillip C
Current Estimated Value
Purchase Details
Closed on
Nov 30, 2022
Sold by
Lane Brandon
Bought by
Ryan Jennifer G and Ryan Phillip C
Purchase Details
Closed on
Dec 4, 2007
Sold by
Johnson Lisa D
Bought by
Johnson Lisa D and Lisa D Johnson Family Trust
Purchase Details
Closed on
Jul 10, 2003
Sold by
Case Ryan D
Bought by
Johnson Christopher D
Home Financials for this Owner
Home Financials are based on the most recent Mortgage that was taken out on this home.
Original Mortgage
$58,950
Interest Rate
5.3%
Mortgage Type
Purchase Money Mortgage
Purchase Details
Closed on
Jul 29, 1997
Sold by
Page Dessie V and Page Verna C
Bought by
Case Ryan D
Home Financials for this Owner
Home Financials are based on the most recent Mortgage that was taken out on this home.
Original Mortgage
$34,700
Interest Rate
7.87%
Purchase Details
Closed on
Sep 14, 1992
Create a Home Valuation Report for This Property
The Home Valuation Report is an in-depth analysis detailing your home's value as well as a comparison with similar homes in the area
Home Values in the Area
Average Home Value in this Area
Purchase History
| Date | Buyer | Sale Price | Title Company |
|---|---|---|---|
| Ryan Jennifer G | $130,000 | Associates Title | |
| Ryan Jennifer G | $130,000 | Associates Title | |
| Johnson Lisa D | -- | Attorney | |
| Johnson Lisa D | -- | Attorney | |
| Johnson Christopher D | $65,500 | Chicago Title | |
| Case Ryan D | $38,600 | Chicago Title | |
| -- | $34,900 | -- |
Source: Public Records
Mortgage History
| Date | Status | Borrower | Loan Amount |
|---|---|---|---|
| Previous Owner | Johnson Christopher D | $58,950 | |
| Previous Owner | Case Ryan D | $34,700 |
Source: Public Records
Tax History Compared to Growth
Tax History
| Year | Tax Paid | Tax Assessment Tax Assessment Total Assessment is a certain percentage of the fair market value that is determined by local assessors to be the total taxable value of land and additions on the property. | Land | Improvement |
|---|---|---|---|---|
| 2024 | $1,437 | $41,830 | $12,430 | $29,400 |
| 2023 | $1,518 | $41,830 | $12,430 | $29,400 |
| 2022 | $1,675 | $28,700 | $4,270 | $24,430 |
| 2021 | $1,678 | $28,700 | $4,270 | $24,430 |
| 2020 | $1,680 | $28,700 | $4,270 | $24,430 |
| 2019 | $1,321 | $21,250 | $3,150 | $18,100 |
| 2018 | $1,353 | $21,250 | $3,150 | $18,100 |
| 2017 | $1,422 | $21,250 | $3,150 | $18,100 |
| 2016 | $1,522 | $22,410 | $3,470 | $18,940 |
| 2015 | $1,386 | $22,410 | $3,470 | $18,940 |
| 2014 | $1,390 | $22,410 | $3,470 | $18,940 |
| 2013 | $685 | $22,400 | $3,465 | $18,935 |
Source: Public Records
Map
Nearby Homes
- 1075 Merrimar Cir N Unit B
- 1022 Galliton Ct Unit C
- 4692 Charecote Ln Unit E
- 1046 Merrimar Cir N Unit B
- 4655 Merrimar Cir E Unit E
- 1030 Galliton Ct Unit B
- 1033 Folkestone Rd
- 4925-4927 Godown Rd
- 4319 Kenmont Place
- 4818 -4820 Winterset Dr
- 1147 Langland Dr
- 1424 Havencrest Ct
- 1466 Weybridge Rd
- 1415 Reymond Rd
- 655 Providence Ave Unit 9-655j
- 1161 Bethel Rd Unit 103/104
- 4714-4716 Arthur Ct
- 4878 Arthur Place
- 652 Olde Towne Ave Unit 9-652 G
- 652 Olde Towne Ave Unit 9-652E
- 1088 Merrimar Cir S Unit 1088B
- 1088 Merrimar Cir S Unit 1088A
- 1088 Merrimar Cir S Unit 1088G
- 1088 Merrimar Cir S Unit E
- 1088 Merrimar Cir S
- 1088 Merrimar Cir S
- 1088 Merrimar Cir S Unit 1088H
- 1088 Merrimar Cir S Unit A
- 1088 Merrimar Cir S Unit C
- 1088 Merrimar Cir S Unit G
- 1088 Merrimar Cir S Unit B
- 1088 Merrimar Cir S Unit D
- 1088 Merrimar Cir S Unit 1088-E
- 1088 Merrimar Cir S Unit H
- 1088 Merrimar Cir S Unit B
- 1094 Merrimar Cir S
- 1094 Merrimar Cir S Unit 1094D
- 1094 Merrimar Cir S Unit 1094H
- 1094 Merrimar Cir S Unit 1094E
- 1094 Merrimar Cir S Unit 1094A