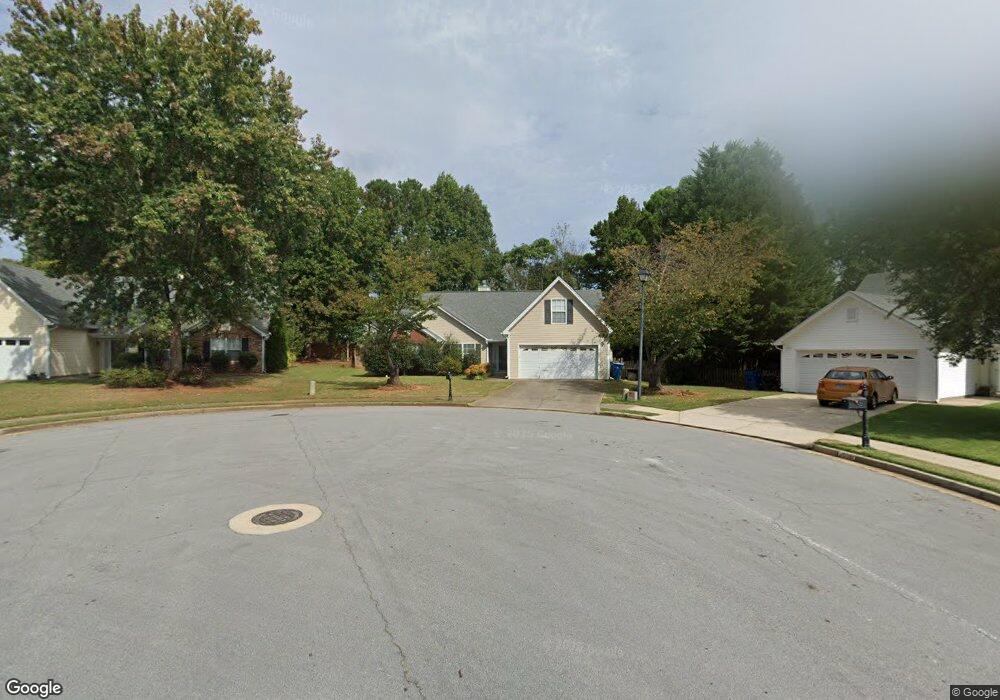
1089 Harbins Pass Dr Unit 34 Dacula, GA 30019
Estimated Value: $360,000 - $390,000
3
Beds
2
Baths
2,142
Sq Ft
$175/Sq Ft
Est. Value
About This Home
This home is located at 1089 Harbins Pass Dr Unit 34, Dacula, GA 30019 and is currently estimated at $375,018, approximately $175 per square foot. 1089 Harbins Pass Dr Unit 34 is a home located in Gwinnett County with nearby schools including Dacula Elementary School, Dacula Middle School, and Dacula High School.
Ownership History
Date
Name
Owned For
Owner Type
Purchase Details
Closed on
Jul 26, 2024
Sold by
Ruberte Joseph G
Bought by
Mejia Wendy
Current Estimated Value
Home Financials for this Owner
Home Financials are based on the most recent Mortgage that was taken out on this home.
Original Mortgage
$356,250
Outstanding Balance
$351,563
Interest Rate
6.86%
Mortgage Type
New Conventional
Estimated Equity
$23,455
Purchase Details
Closed on
Nov 29, 2016
Sold by
Ney Dianne L
Bought by
Ruberte Joseph G and Ruberte Vionette A
Purchase Details
Closed on
Aug 22, 2005
Sold by
Alexander Susan L
Bought by
Ney Dianne L
Home Financials for this Owner
Home Financials are based on the most recent Mortgage that was taken out on this home.
Original Mortgage
$45,000
Interest Rate
5.71%
Purchase Details
Closed on
Sep 20, 2002
Sold by
Riverside Management Corp
Bought by
Alexander Susan L
Home Financials for this Owner
Home Financials are based on the most recent Mortgage that was taken out on this home.
Original Mortgage
$148,646
Interest Rate
6.21%
Create a Home Valuation Report for This Property
The Home Valuation Report is an in-depth analysis detailing your home's value as well as a comparison with similar homes in the area
Home Values in the Area
Average Home Value in this Area
Purchase History
| Date | Buyer | Sale Price | Title Company |
|---|---|---|---|
| Mejia Wendy | $375,000 | -- | |
| Ruberte Joseph G | $165,000 | -- | |
| Ney Dianne L | $161,500 | -- | |
| Alexander Susan L | $151,000 | -- |
Source: Public Records
Mortgage History
| Date | Status | Borrower | Loan Amount |
|---|---|---|---|
| Open | Mejia Wendy | $356,250 | |
| Previous Owner | Ney Dianne L | $45,000 | |
| Previous Owner | Alexander Susan L | $148,646 |
Source: Public Records
Tax History Compared to Growth
Tax History
| Year | Tax Paid | Tax Assessment Tax Assessment Total Assessment is a certain percentage of the fair market value that is determined by local assessors to be the total taxable value of land and additions on the property. | Land | Improvement |
|---|---|---|---|---|
| 2025 | $5,507 | $147,560 | $26,120 | $121,440 |
| 2024 | $1,168 | $149,680 | $30,400 | $119,280 |
| 2023 | $1,168 | $149,680 | $30,400 | $119,280 |
| 2022 | $1,127 | $127,160 | $23,200 | $103,960 |
| 2021 | $1,116 | $92,840 | $17,200 | $75,640 |
| 2020 | $1,114 | $78,480 | $15,200 | $63,280 |
| 2019 | $1,032 | $78,480 | $15,200 | $63,280 |
| 2018 | $1,021 | $78,480 | $15,200 | $63,280 |
| 2016 | $976 | $65,200 | $12,000 | $53,200 |
| 2015 | $920 | $54,680 | $10,400 | $44,280 |
| 2014 | $2,082 | $54,680 | $10,400 | $44,280 |
Source: Public Records
Map
Nearby Homes
- 1032 Harbins Pass Dr
- 915 Harbins View Dr
- 909 Pathview Ct
- 1042 Auburn Rd
- 872 Pathview Ct
- 1040 Auburn Rd
- 861 Bailey Woods Rd
- 2905 The Terraces Way
- 802 Pathview Ct
- 1090 River Valley Dr
- 3350 Stratton Ln
- 956 Chippewa Oak Dr
- 3110 Flatbottom Dr
- 3197 Eastham Run Dr
- 990 Mulberry Bay Dr
- 3192 Eastham Run Dr
- 3078 Hudson Glen Way
- 1089 Harbins Pass Dr
- 1079 Harbins Pass Dr Unit 35
- 1079 Harbins Pass Dr
- 1099 Harbins Pass Dr
- 802 Madison Cove Way
- 910 Charles Hall Dr
- 1109 Harbins Pass Dr
- 1069 Harbins Pass Dr
- 900 Charles Hall Dr
- 2795 Wadley Ln
- 803 Madison Cove Way
- 920 Charles Hall Dr
- 812 Madison Cove Way
- 2780 Wadley Ln
- 1102 Harbins Pass Dr
- 890 Charles Hall Dr
- 1059 Harbins Pass Dr
- 1119 Harbins Pass Dr
- 2805 Wadley Ln
- 2805 Wadley Ln