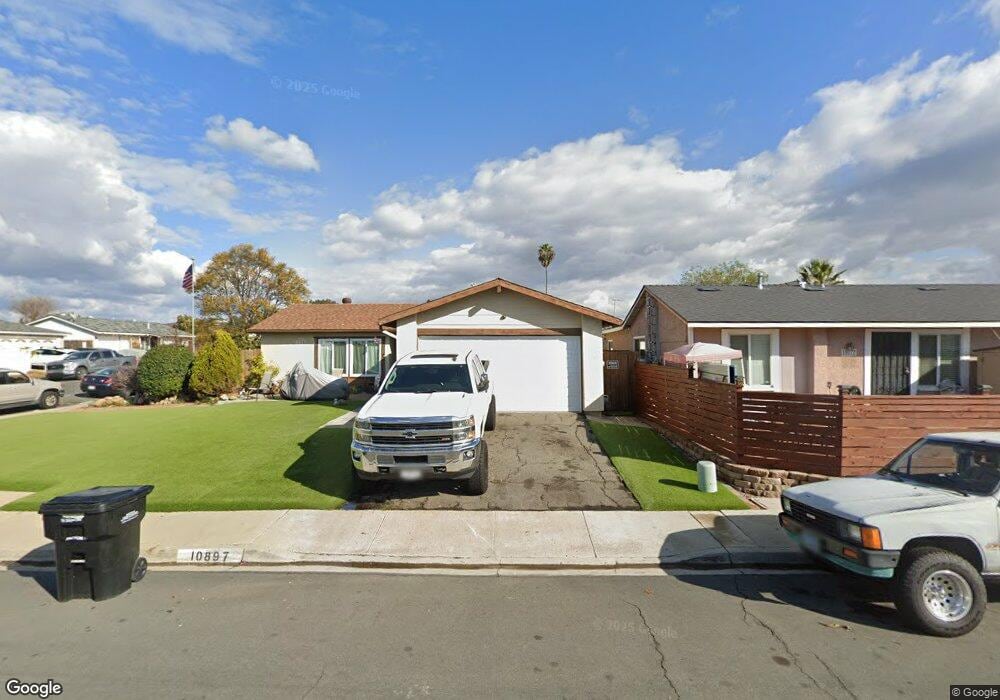
10897 Via San Blas San Diego, CA 92126
Mira Mesa NeighborhoodEstimated Value: $944,008 - $1,085,000
4
Beds
2
Baths
1,320
Sq Ft
$776/Sq Ft
Est. Value
About This Home
This home is located at 10897 Via San Blas, San Diego, CA 92126 and is currently estimated at $1,024,752, approximately $776 per square foot. 10897 Via San Blas is a home located in San Diego County with nearby schools including Hage Elementary School, Wangenheim Middle School, and Mira Mesa High School.
Ownership History
Date
Name
Owned For
Owner Type
Purchase Details
Closed on
Jul 31, 2018
Sold by
Mansker Michelle and The David Uren Revocable Trust
Bought by
Uren Frank David
Current Estimated Value
Purchase Details
Closed on
Oct 7, 2015
Sold by
Uren David B
Bought by
Uren David B
Purchase Details
Closed on
Jun 15, 1983
Create a Home Valuation Report for This Property
The Home Valuation Report is an in-depth analysis detailing your home's value as well as a comparison with similar homes in the area
Home Values in the Area
Average Home Value in this Area
Purchase History
| Date | Buyer | Sale Price | Title Company |
|---|---|---|---|
| Uren Frank David | -- | None Available | |
| Uren Frank D | -- | None Available | |
| Uren David B | -- | None Available | |
| -- | $86,500 | -- |
Source: Public Records
Tax History Compared to Growth
Tax History
| Year | Tax Paid | Tax Assessment Tax Assessment Total Assessment is a certain percentage of the fair market value that is determined by local assessors to be the total taxable value of land and additions on the property. | Land | Improvement |
|---|---|---|---|---|
| 2025 | $964 | $75,710 | $20,526 | $55,184 |
| 2024 | $964 | $74,226 | $20,124 | $54,102 |
| 2023 | $942 | $72,772 | $19,730 | $53,042 |
| 2022 | $916 | $71,346 | $19,344 | $52,002 |
| 2021 | $910 | $69,948 | $18,965 | $50,983 |
| 2020 | $899 | $69,232 | $18,771 | $50,461 |
| 2019 | $883 | $566,100 | $459,000 | $107,100 |
| 2018 | $1,814 | $157,470 | $54,624 | $102,846 |
| 2017 | $81 | $154,383 | $53,553 | $100,830 |
| 2016 | $1,735 | $151,356 | $52,503 | $98,853 |
| 2015 | $1,708 | $149,084 | $51,715 | $97,369 |
| 2014 | $1,681 | $146,164 | $50,702 | $95,462 |
Source: Public Records
Map
Nearby Homes
- 8943 Calliandra Rd
- 8727 Westmore Rd Unit 24
- 8669 Summerdale Rd
- 10805 Eberly Ct
- 8650 New Salem St Unit 27
- 8644 New Salem St Unit 6
- 8654 New Salem St Unit 44
- 8595 Summerdale Rd Unit 170
- 10770 Black Mountain Rd Unit 220
- 10770 Black Mountain Rd
- 8485 Westmore Rd Unit 40
- 10582 Caminito Glenellen
- 8488 New Salem St
- 8476 New Salem St Unit 77
- 8479 Westmore Rd Unit 55
- 8849 Capricorn Way
- 10771 Black Mountain Rd Unit 58
- 8686 Perseus Rd
- 9310 Galvin Ave Unit 15
- 8378 New Salem St Unit 24
- 10877 Via San Blas
- 8944 Via Caracas
- 8950 Via Caracas
- 8935 Westmore Rd
- 8956 Via Caracas
- 8945 Westmore Rd
- 8962 Via Caracas
- 10886 Via San Blas
- 10876 Via San Blas
- 10896 Via San Blas
- 8955 Westmore Rd
- 10866 Via San Blas
- 8940 Westmore Rd
- 8968 Via Caracas
- 8948 Westmore Rd
- 10856 Via San Blas
- 8956 Westmore Rd
- 8943 Via Caracas
- 8949 Via Caracas
- 8965 Westmore Rd