Estimated Value: $284,699 - $290,000
3
Beds
2
Baths
1,920
Sq Ft
$149/Sq Ft
Est. Value
About This Home
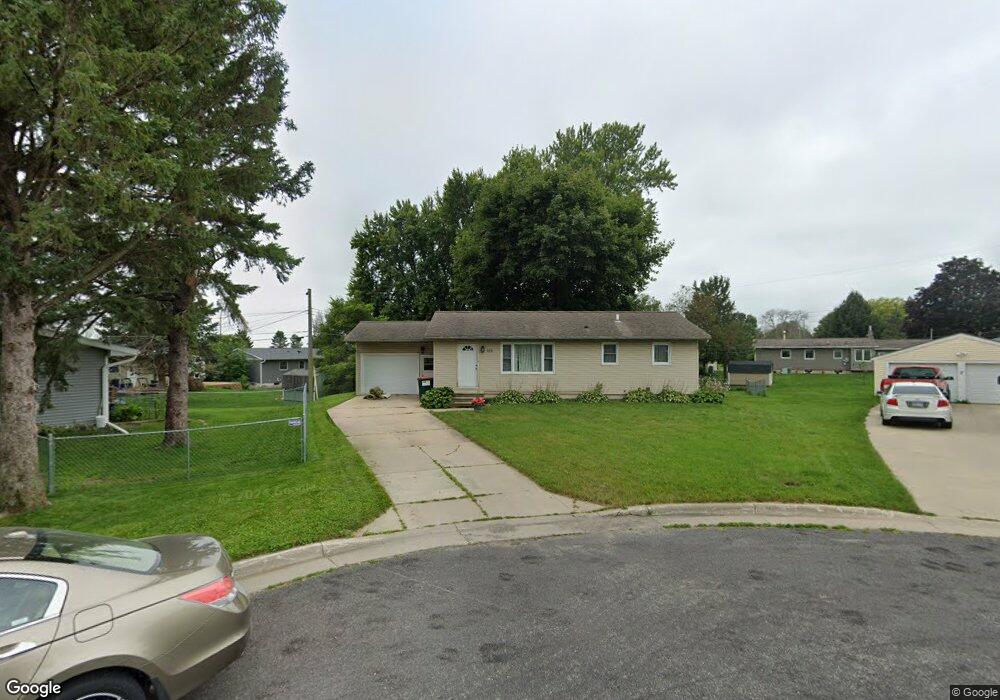
This home is located at 109 109 3rd-Avenue-nw, Byron, MN 55920 and is currently estimated at $286,425, approximately $149 per square foot. 109 109 3rd-Avenue-nw is a home located in Olmsted County with nearby schools including Byron Intermediate School, Byron Middle School, and Byron Senior High School.
Ownership History
Date
Name
Owned For
Owner Type
Purchase Details
Closed on
Oct 23, 2015
Sold by
Kobi Nicholas and Kobi Mary
Bought by
Wills Gregory D and Tentis Amy L
Current Estimated Value
Home Financials for this Owner
Home Financials are based on the most recent Mortgage that was taken out on this home.
Original Mortgage
$154,000
Outstanding Balance
$124,122
Interest Rate
4.62%
Mortgage Type
Adjustable Rate Mortgage/ARM
Estimated Equity
$162,303
Purchase Details
Closed on
Apr 20, 2012
Sold by
Roeder Mary and Kobi Mary
Bought by
Kobi Mary and Kobi Nicholas
Purchase Details
Closed on
Dec 15, 2009
Sold by
State Farm Bank Fsb
Bought by
Roeder Mary
Home Financials for this Owner
Home Financials are based on the most recent Mortgage that was taken out on this home.
Original Mortgage
$68,100
Interest Rate
5.02%
Mortgage Type
New Conventional
Purchase Details
Closed on
Oct 24, 2008
Sold by
Todeff Jason B
Bought by
State Farm Bank Fsb
Create a Home Valuation Report for This Property
The Home Valuation Report is an in-depth analysis detailing your home's value as well as a comparison with similar homes in the area
Home Values in the Area
Average Home Value in this Area
Purchase History
| Date | Buyer | Sale Price | Title Company |
|---|---|---|---|
| Wills Gregory D | $154,000 | Partners Title Roch | |
| Kobi Mary | -- | None Available | |
| Roeder Mary | $86,000 | None Available | |
| State Farm Bank Fsb | $84,508 | None Available |
Source: Public Records
Mortgage History
| Date | Status | Borrower | Loan Amount |
|---|---|---|---|
| Open | Wills Gregory D | $154,000 | |
| Previous Owner | Roeder Mary | $68,100 |
Source: Public Records
Tax History Compared to Growth
Tax History
| Year | Tax Paid | Tax Assessment Tax Assessment Total Assessment is a certain percentage of the fair market value that is determined by local assessors to be the total taxable value of land and additions on the property. | Land | Improvement |
|---|---|---|---|---|
| 2024 | $3,692 | $250,200 | $40,000 | $210,200 |
| 2023 | $3,670 | $246,000 | $35,000 | $211,000 |
| 2022 | $3,298 | $232,300 | $35,000 | $197,300 |
| 2021 | $2,782 | $197,500 | $35,000 | $162,500 |
| 2020 | $2,582 | $180,400 | $35,000 | $145,400 |
| 2019 | $2,396 | $166,200 | $25,000 | $141,200 |
| 2018 | $2,139 | $156,700 | $25,000 | $131,700 |
| 2017 | $1,964 | $150,200 | $25,000 | $125,200 |
| 2016 | $1,320 | $109,800 | $16,300 | $93,500 |
| 2015 | $1,268 | $71,200 | $14,300 | $56,900 |
| 2014 | $1,204 | $71,200 | $14,300 | $56,900 |
| 2012 | -- | $73,200 | $14,452 | $58,748 |
Source: Public Records
Map
Nearby Homes
- 519 3rd St NW
- 423 3rd Ave NW
- 504 3rd Ave NW
- 603 3rd Ave NW
- 610 3rd Ave NW
- 500 9th Ave NW
- 413 9th Ave NW
- 222 7th St NW
- 607 9th St NW
- 403 3rd Ave NE
- 328 10th St NW
- TBD 708th St
- 942 Byron Ave N
- 228 9th St NE
- 1005 4th Ave NE
- 1420 Voll Dr NW
- 172 Somerby Pkwy NE
- 154 Somerby Pkwy NE
- 190 Somerby Pkwy NE
- 208 Somerby Pkwy NE
- 109 3rd Ave NW
- 105 3rd Ave NW
- 113 3rd Ave NW
- 106 4th Ave NW
- 309 1st St NW
- 305 1st St NW
- 110 4th Ave NW
- 102 4th Ave NW
- 115 3rd Ave NW
- 114 4th Ave NW
- 119 3rd Ave NW
- 118 4th Ave NW
- 120 3rd Ave NW
- 120 120 3rd-Avenue-nw
- 314 2nd St NW
- 116 3rd Ave NW
- 302 2nd St NW
- 320 2nd St NW
- 320 320 2nd-Street-nw
- 310 2nd St NW