
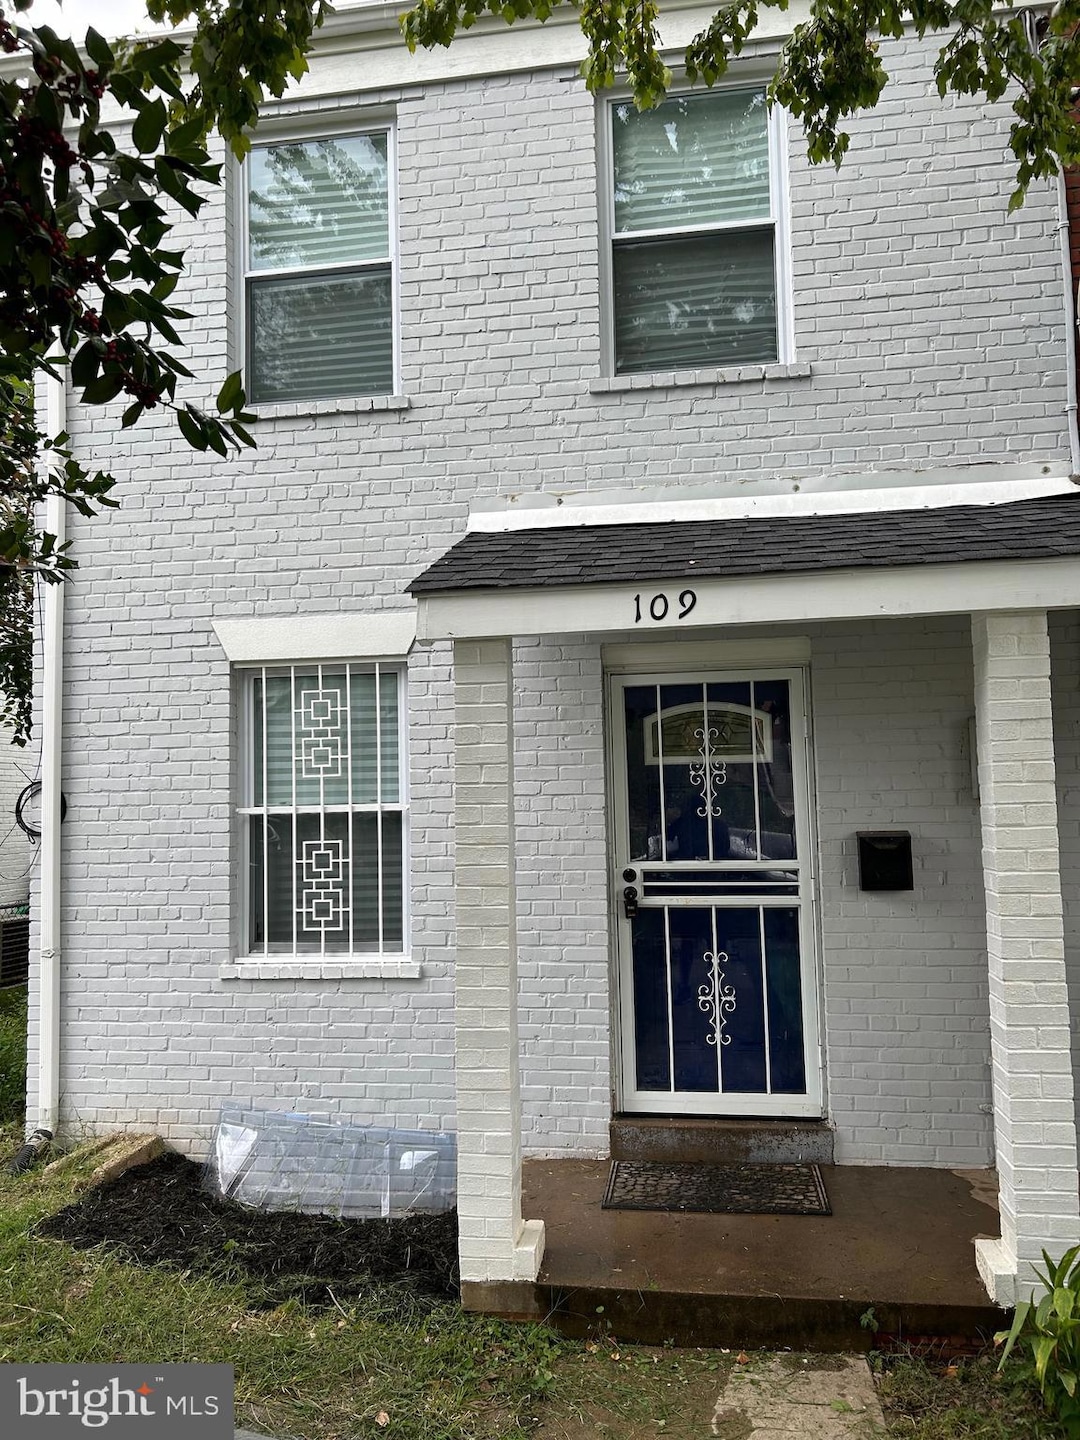
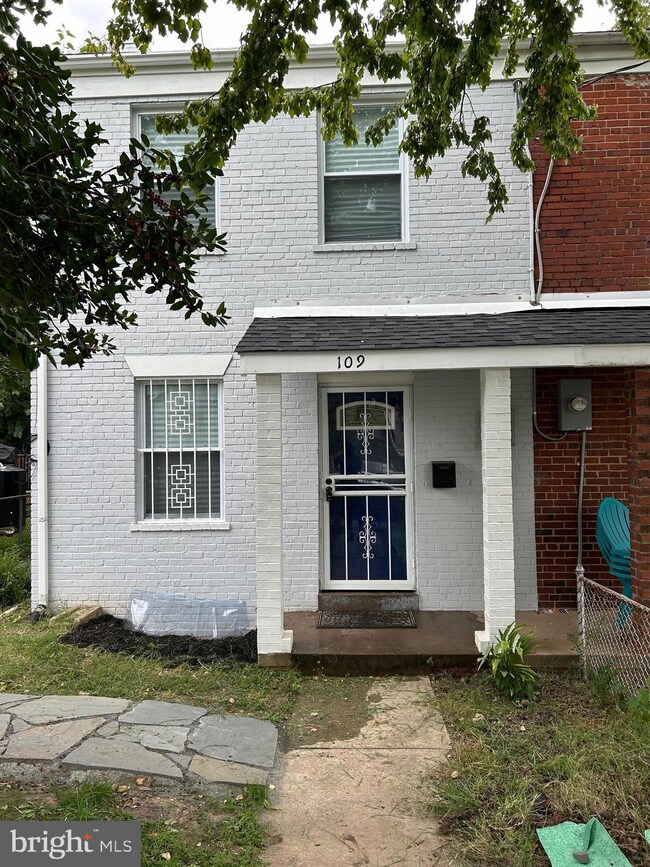
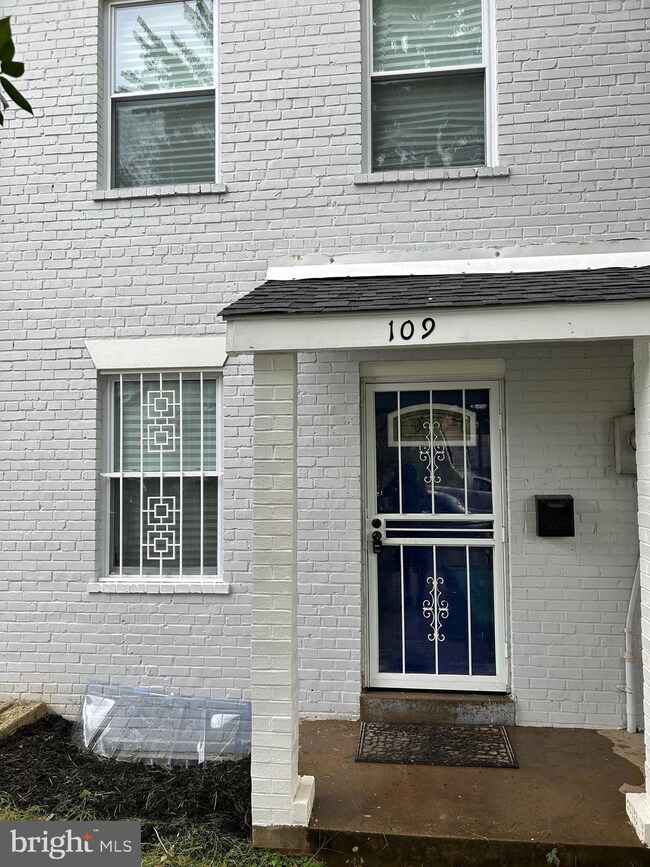
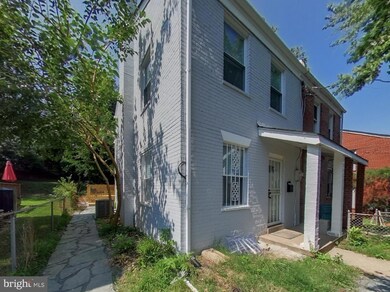
109 47th St SE Washington, DC 20019
Marshall Heights Neighborhood
3
Beds
3
Baths
1,648
Sq Ft
2,589
Sq Ft Lot
About This Home
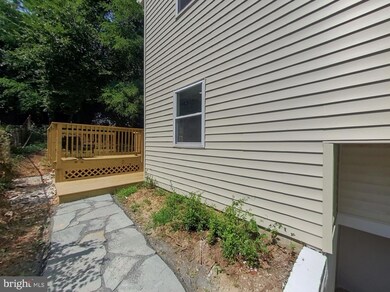
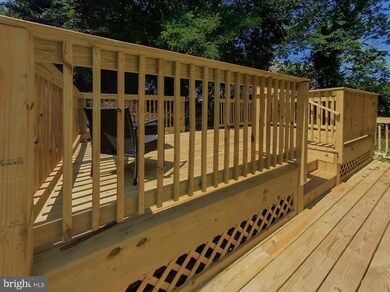
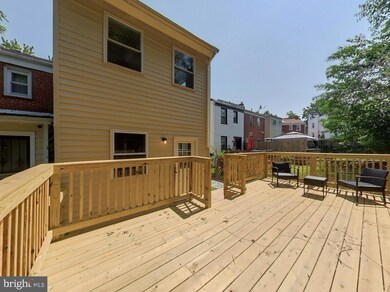
As of December 2024Seller will pay $10,000 towards buyer’s closing cost with a full price offer. Discover your new sanctuary in the heart of Washington, DC! This impeccably renovated 3-bedroom, 3-bathroom townhome effortlessly combines modern elegance with urban convenience. Step inside to find a living area bathed in natural light, a gourmet kitchen with high-end appliances, and three luxurious bathrooms featuring contemporary fixtures and finishes. THIS HOME FEELS LIKE A SINGLE FAMILY HOME WITH ITS SIZE AND NATURAL LIGHTING. The spacious bedrooms offer ample closet space, and the primary suite boasts a spa-LIKE bathroom retreat. Convenient basement entry access to the back of the house. Can be used for rental or simple access for entertainment. Sit on the large back deck and enjoy comfortable seating and while embracing nature. Located in a vibrant neighborhood, this home provides easy access to top dining, shopping, and cultural attractions. Easy access to public transportation and metro access. Don't miss the chance to own this stunning townhome! NO HOA!!! MOVE IN READY!!! AGENT OWNER
Last Agent to Sell the Property
Samson Properties License #SP200203564 Listed on: 08/07/2024
Townhouse Details
Home Type
- Townhome
Year Built
- Built in 1945
Parking
- On-Street Parking
Home Design
- Federal Architecture
- Brick Exterior Construction
Interior Spaces
- Property has 3 Levels
Bedrooms and Bathrooms
- 3 Bedrooms
Finished Basement
- Walk-Out Basement
- Rear Basement Entry
- Basement Windows
Additional Features
- 2,589 Sq Ft Lot
- Private Sewer
Community Details
- No Home Owners Association
- Marshall Heights Subdivision
Listing and Financial Details
- Tax Lot 4
- Assessor Parcel Number 5349/S/0004
Ownership History
Date
Name
Owned For
Owner Type
Purchase Details
Listed on
Aug 7, 2024
Closed on
Dec 17, 2024
Sold by
Ayers Street Llc
Bought by
Faunteroy Alexus
Seller's Agent
James Wilkins
Samson Properties
Buyer's Agent
Tiffany Renwick
Compass
List Price
$449,900
Sold Price
$439,900
Premium/Discount to List
-$10,000
-2.22%
Total Days on Market
36
Views
89
Current Estimated Value
Home Financials for this Owner
Home Financials are based on the most recent Mortgage that was taken out on this home.
Estimated Appreciation
-$17,697
Avg. Annual Appreciation
-1.83%
Original Mortgage
$84,800
Outstanding Balance
$81,379
Interest Rate
6.69%
Estimated Equity
$352,616
Similar Homes in Washington, DC
Create a Home Valuation Report for This Property
The Home Valuation Report is an in-depth analysis detailing your home's value as well as a comparison with similar homes in the area
Home Values in the Area
Average Home Value in this Area
Purchase History
| Date | Type | Sale Price | Title Company |
|---|---|---|---|
| Deed | $439,900 | Westcor Land Title Insurance C |
Source: Public Records
Mortgage History
| Date | Status | Loan Amount | Loan Type |
|---|---|---|---|
| Open | $84,800 | No Value Available | |
| Open | $348,758 | New Conventional | |
| Previous Owner | $244,000 | New Conventional |
Source: Public Records
Property History
| Date | Event | Price | Change | Sq Ft Price |
|---|---|---|---|---|
| 12/18/2024 12/18/24 | Sold | $439,900 | +0.1% | $267 / Sq Ft |
| 09/14/2024 09/14/24 | Off Market | $439,500 | -- | -- |
| 09/13/2024 09/13/24 | Pending | -- | -- | -- |
| 09/12/2024 09/12/24 | Price Changed | $439,500 | -0.1% | $267 / Sq Ft |
| 09/09/2024 09/09/24 | Price Changed | $439,900 | -0.7% | $267 / Sq Ft |
| 09/06/2024 09/06/24 | Price Changed | $443,000 | -0.2% | $269 / Sq Ft |
| 09/05/2024 09/05/24 | Price Changed | $443,900 | -0.2% | $269 / Sq Ft |
| 09/04/2024 09/04/24 | Price Changed | $444,900 | -0.4% | $270 / Sq Ft |
| 09/02/2024 09/02/24 | Price Changed | $446,500 | -0.1% | $271 / Sq Ft |
| 08/31/2024 08/31/24 | Price Changed | $447,000 | -0.2% | $271 / Sq Ft |
| 08/26/2024 08/26/24 | Price Changed | $448,000 | -0.2% | $272 / Sq Ft |
| 08/19/2024 08/19/24 | Price Changed | $449,000 | -0.2% | $272 / Sq Ft |
| 08/07/2024 08/07/24 | For Sale | $449,900 | +121.6% | $273 / Sq Ft |
| 02/13/2023 02/13/23 | Sold | $203,000 | 0.0% | $140 / Sq Ft |
| 12/21/2022 12/21/22 | Pending | -- | -- | -- |
| 12/17/2022 12/17/22 | Off Market | $203,000 | -- | -- |
| 12/13/2022 12/13/22 | For Sale | $250,000 | +23.2% | $172 / Sq Ft |
| 12/12/2022 12/12/22 | Pending | -- | -- | -- |
| 12/10/2022 12/10/22 | Off Market | $203,000 | -- | -- |
| 12/05/2022 12/05/22 | For Sale | $250,000 | +23.2% | $172 / Sq Ft |
| 12/05/2022 12/05/22 | Off Market | $203,000 | -- | -- |
| 12/04/2022 12/04/22 | For Sale | $250,000 | -- | $172 / Sq Ft |
Source: Bright MLS
Tax History Compared to Growth
Tax History
| Year | Tax Paid | Tax Assessment Tax Assessment Total Assessment is a certain percentage of the fair market value that is determined by local assessors to be the total taxable value of land and additions on the property. | Land | Improvement |
|---|---|---|---|---|
| 2024 | $14,888 | $297,750 | $143,330 | $154,420 |
| 2023 | $2,480 | $291,820 | $140,580 | $151,240 |
| 2022 | $13,508 | $270,150 | $133,020 | $137,130 |
| 2021 | $12,991 | $259,810 | $132,450 | $127,360 |
| 2020 | $2,085 | $245,300 | $126,650 | $118,650 |
| 2019 | $1,968 | $231,500 | $125,570 | $105,930 |
| 2018 | $1,709 | $201,060 | $0 | $0 |
| 2017 | $1,513 | $177,970 | $0 | $0 |
| 2016 | $1,431 | $168,350 | $0 | $0 |
| 2015 | $1,335 | $157,090 | $0 | $0 |
| 2014 | $1,267 | $149,020 | $0 | $0 |
Source: Public Records
Agents Affiliated with this Home
-
James Wilkins
Seller's Agent in 2024
James Wilkins
Samson Properties
(571) 249-0318
3 in this area
55 Total Sales
-
Julie Robinson
J
Seller Co-Listing Agent in 2024
Julie Robinson
Samson Properties
(571) 346-9233
1 in this area
5 Total Sales
-
Tiffany Renwick
Buyer's Agent in 2024
Tiffany Renwick
Compass
(310) 963-7611
2 in this area
33 Total Sales
-
Wendy Mason
Seller's Agent in 2023
Wendy Mason
Samson Properties
(202) 905-1127
1 in this area
16 Total Sales
Map
Source: Bright MLS
MLS Number: DCDC2139750
APN: 5349S-0004
Disclaimer: Certain information contained herein is derived from information provided by parties other than Homes.com. All information provided is deemed reliable, but is not guaranteed to be accurate and should be independently verified.
![]() The data relating to real estate for sale on this website appears in part through the BRIGHT Internet Data Exchange program, a voluntary cooperative exchange of property listing data between licensed real estate brokerage firms, and is provided by BRIGHT through a licensing agreement.
The data relating to real estate for sale on this website appears in part through the BRIGHT Internet Data Exchange program, a voluntary cooperative exchange of property listing data between licensed real estate brokerage firms, and is provided by BRIGHT through a licensing agreement.
Listing information is from various brokers who participate in the Bright MLS IDX program and not all listings may be visible on the site.
The property information being provided on or through the website is for the personal, non-commercial use of consumers and such information may not be used for any purpose other than to identify prospective properties consumers may be interested in purchasing.
Some properties which appear for sale on the website may no longer be available because they are for instance, under contract, sold or are no longer being offered for sale.
Property information displayed is deemed reliable but is not guaranteed.
Copyright 2025 Bright MLS, Inc.
Nearby Homes
- 44 47th St SE
- 46 47th St SE
- 121 49th St SE
- 9 47th St SE
- 4923 1/2 A St SE
- 4928 Astor Place SE
- 4636 A St SE
- 4910 E Capitol St NE
- 4900 E Capitol St NE
- 4621 A St SE
- 114 46th St SE
- 4627 Central Ave NE
- 4800 C St SE Unit 104
- 4800 C St SE Unit 102
- 17 46th St SE Unit 5
- 5001 Astor Place SE
- 5 46th St SE Unit 6
- 5017 Ayers Place SE
- 5021 A St SE Unit 5025
- 108 50th St NE