Estimated Value: $160,500 - $193,000
3
Beds
1
Bath
1,038
Sq Ft
$171/Sq Ft
Est. Value
About This Home
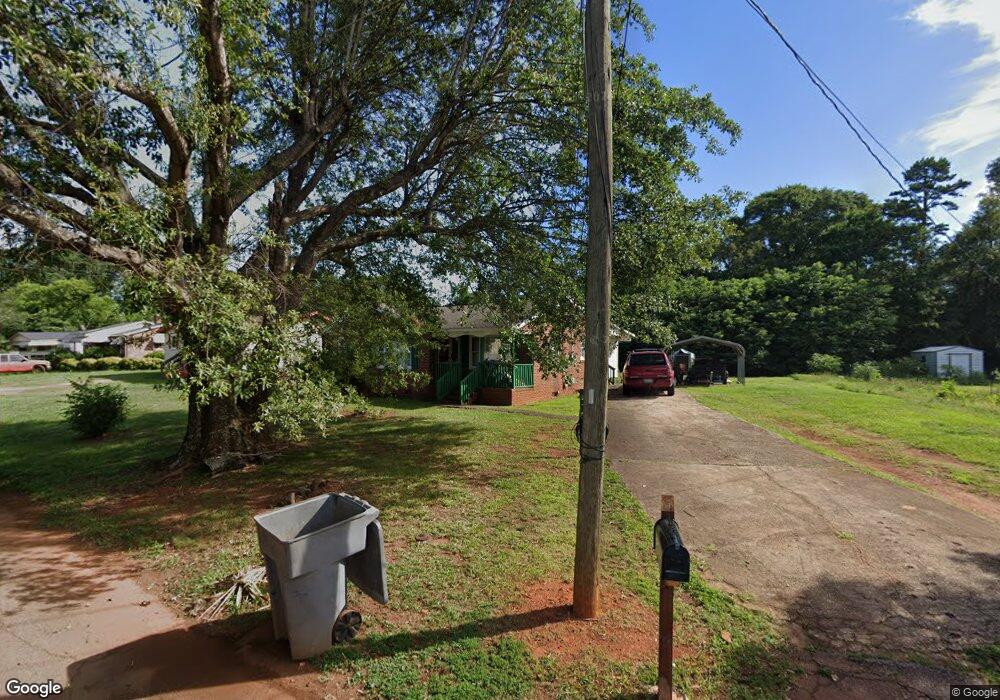
This home is located at 109 Ash Ave, Lyman, SC 29365 and is currently estimated at $177,875, approximately $171 per square foot. 109 Ash Ave is a home with nearby schools including Wellford Academy Of Science And Techology, Byrnes Freshman Academy, and D.R. Hill Middle School.
Ownership History
Date
Name
Owned For
Owner Type
Purchase Details
Closed on
Feb 29, 2024
Sold by
Dudley Deborah
Bought by
Nesbitt Akayla B and Cohen-Nesbitt Kunagee R
Current Estimated Value
Home Financials for this Owner
Home Financials are based on the most recent Mortgage that was taken out on this home.
Original Mortgage
$129,200
Outstanding Balance
$126,912
Interest Rate
6.6%
Mortgage Type
New Conventional
Estimated Equity
$50,963
Purchase Details
Closed on
Apr 25, 2023
Sold by
Nesbitt Betty Jo
Bought by
Dudley Deborah
Create a Home Valuation Report for This Property
The Home Valuation Report is an in-depth analysis detailing your home's value as well as a comparison with similar homes in the area
Home Values in the Area
Average Home Value in this Area
Purchase History
| Date | Buyer | Sale Price | Title Company |
|---|---|---|---|
| Nesbitt Akayla B | $152,000 | None Listed On Document | |
| Dudley Deborah | -- | None Listed On Document |
Source: Public Records
Mortgage History
| Date | Status | Borrower | Loan Amount |
|---|---|---|---|
| Open | Nesbitt Akayla B | $129,200 |
Source: Public Records
Tax History
| Year | Tax Paid | Tax Assessment Tax Assessment Total Assessment is a certain percentage of the fair market value that is determined by local assessors to be the total taxable value of land and additions on the property. | Land | Improvement |
|---|---|---|---|---|
| 2025 | $1,474 | $6,080 | $1,424 | $4,656 |
| 2024 | $1,474 | $6,040 | $1,424 | $4,616 |
| 2023 | $1,474 | $9,060 | $2,136 | $6,924 |
Source: Public Records
Map
Nearby Homes
- 107 Cottage St
- 113 Burns St
- 1129 Old Spartanburg Hwy
- 181 Dodd St
- 193 Dodd St
- 136 Moore St
- 179 Cedar Ave
- 177 Cedar Ave
- 228 Wayfair Ln
- 216 Wayfair Ln
- 151 Lynn Dr
- 61 Carver St
- 148 Peterson Dr
- 110 Pacific Mill Place
- 120 Pacific Mill Place
- 106 Pacific Mill Place
- 104 Pacific Mill Place
- 108 Pacific Mill Place
- 118 Pacific Mill Place
- 116 Pacific Mill Place
Your Personal Tour Guide
Ask me questions while you tour the home.