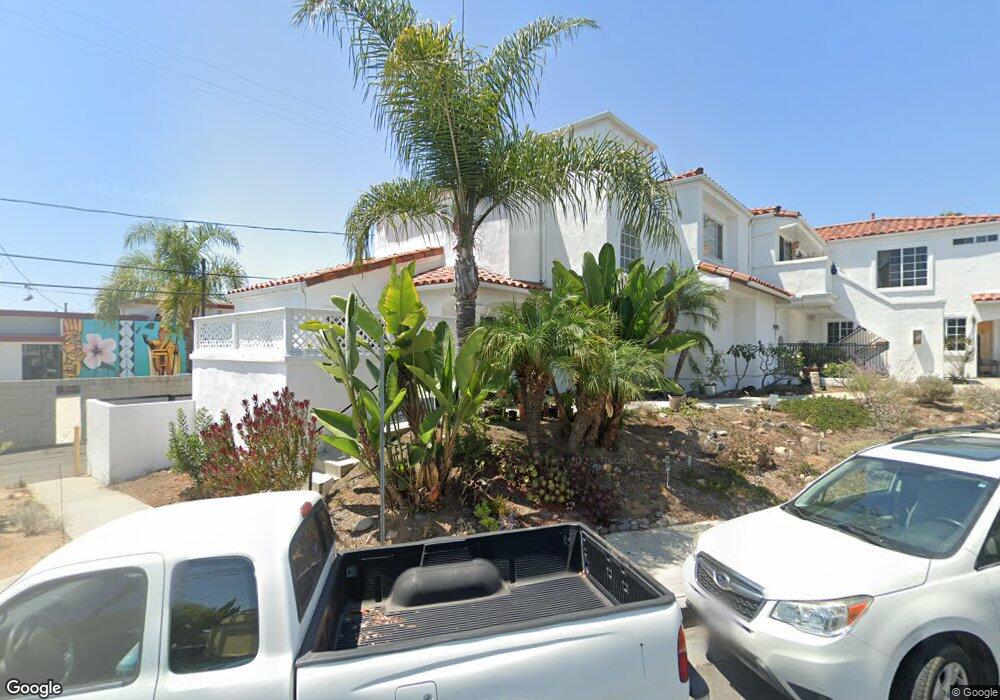
109 Avenida Santa Margarita Unit E San Clemente, CA 92672
Southeast San Clemente NeighborhoodEstimated Value: $694,000 - $892,000
2
Beds
2
Baths
993
Sq Ft
$803/Sq Ft
Est. Value
About This Home
This home is located at 109 Avenida Santa Margarita Unit E, San Clemente, CA 92672 and is currently estimated at $796,973, approximately $802 per square foot. 109 Avenida Santa Margarita Unit E is a home located in Orange County with nearby schools including Concordia Elementary School, Shorecliffs Middle School, and San Clemente High School.
Ownership History
Date
Name
Owned For
Owner Type
Purchase Details
Closed on
May 18, 2015
Sold by
Berry Linda Ann
Bought by
Berry Linda Ann and Linda Living Trust
Current Estimated Value
Purchase Details
Closed on
Jan 10, 2003
Sold by
Watkins Robert
Bought by
Berry Linda Ann
Home Financials for this Owner
Home Financials are based on the most recent Mortgage that was taken out on this home.
Original Mortgage
$265,500
Interest Rate
5.61%
Mortgage Type
Purchase Money Mortgage
Purchase Details
Closed on
Jun 21, 2000
Sold by
Hall William M and Hall Diane K
Bought by
Watkins Robert
Home Financials for this Owner
Home Financials are based on the most recent Mortgage that was taken out on this home.
Original Mortgage
$167,583
Interest Rate
8.55%
Mortgage Type
FHA
Create a Home Valuation Report for This Property
The Home Valuation Report is an in-depth analysis detailing your home's value as well as a comparison with similar homes in the area
Home Values in the Area
Average Home Value in this Area
Purchase History
| Date | Buyer | Sale Price | Title Company |
|---|---|---|---|
| Berry Linda Ann | -- | None Available | |
| Berry Linda Ann | $295,000 | United Title Company | |
| Watkins Robert | $172,500 | Orange Coast Title Company |
Source: Public Records
Mortgage History
| Date | Status | Borrower | Loan Amount |
|---|---|---|---|
| Previous Owner | Berry Linda Ann | $265,500 | |
| Previous Owner | Watkins Robert | $167,583 | |
| Closed | Watkins Robert | $5,175 |
Source: Public Records
Tax History Compared to Growth
Tax History
| Year | Tax Paid | Tax Assessment Tax Assessment Total Assessment is a certain percentage of the fair market value that is determined by local assessors to be the total taxable value of land and additions on the property. | Land | Improvement |
|---|---|---|---|---|
| 2025 | $4,183 | $427,249 | $274,732 | $152,517 |
| 2024 | $4,183 | $418,872 | $269,345 | $149,527 |
| 2023 | $4,094 | $410,659 | $264,063 | $146,596 |
| 2022 | $4,015 | $402,607 | $258,885 | $143,722 |
| 2021 | $3,936 | $394,713 | $253,809 | $140,904 |
| 2020 | $3,896 | $390,666 | $251,206 | $139,460 |
| 2019 | $3,818 | $383,006 | $246,280 | $136,726 |
| 2018 | $3,744 | $375,497 | $241,451 | $134,046 |
| 2017 | $3,669 | $368,135 | $236,717 | $131,418 |
| 2016 | $3,598 | $360,917 | $232,075 | $128,842 |
| 2015 | $3,145 | $316,250 | $197,807 | $118,443 |
| 2014 | $3,146 | $316,250 | $197,807 | $118,443 |
Source: Public Records
Map
Nearby Homes
- 120 Avenida Santa Margarita
- 106 Avenida Lucia
- 3830 Avenida Del Presidente Unit 11
- 3405 S El Camino Real Unit A
- 128 Avenida San Dimas
- 4023 Calle Isabella
- 3811 Vista Blanca
- 4004 Calle Ariana
- 4026 Calle Lisa
- 4006 Calle Ariana
- 4060 Calle Isabella
- 318 Avenida Santa Margarita
- 405 Calle Alicia
- 4130 Calle Isabella
- 2603 Calle Del Comercio
- 2501 S El Camino Real Unit 309
- 2501 S El Camino Real Unit 206
- 2501 S El Camino Real
- 230 Avenida Montalvo
- 257 Avenida Lobeiro Unit D
- 109 Avenida Santa Margarita Unit A
- 109 Avenida Santa Margarita Unit G
- 109 Avenida Santa Margarita Unit B
- 109 Avenida Santa Margarita Unit C
- 109 Avenida Santa Margarita Unit H
- 109 Avenida Santa Margarita Unit I
- 109 Avenida Santa Margarita Unit J
- 109 Avenida Santa Margarita Unit D
- 109 Avenida Santa Margarita Unit F
- 110 Avenida Santa Margarita
- 108 Avenida Santa Margarita
- 112 Avenida Santa Margarita
- 114 Avenida Santa Margarita
- 105 Avenida Pala Unit B
- 105 Avenida Pala Unit A
- 105 Avenida Pala
- 106 Santa Margarita
- 106 Avenida Santa Margarita Unit 2
- 106 Avenida Santa Margarita Unit 1
- 106 Avenida Santa Margarita