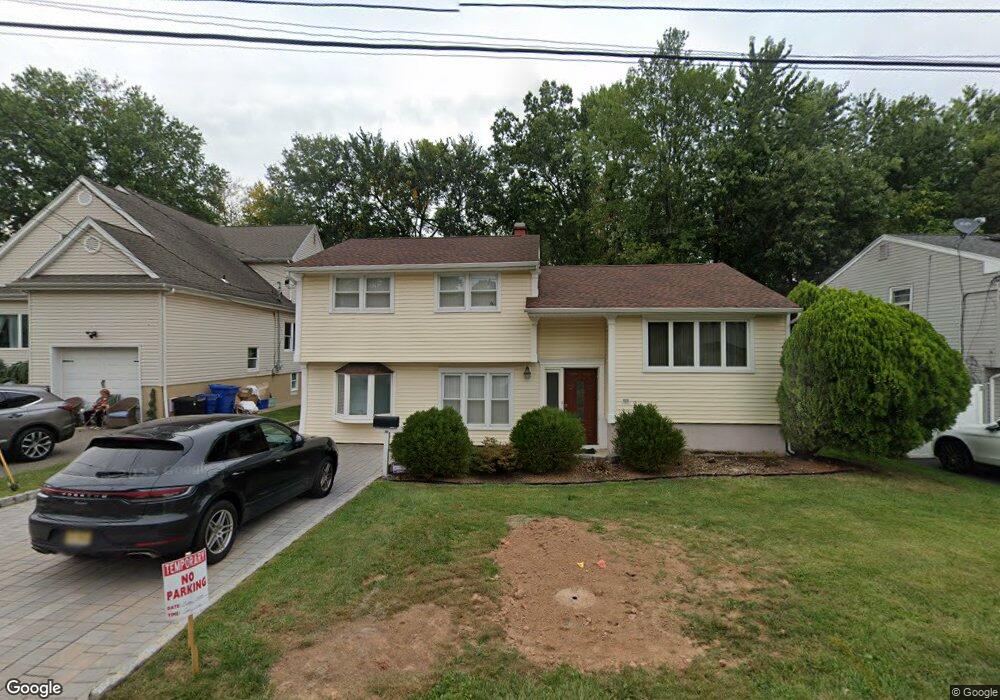
109 Bache Place Dunellen, NJ 08812
Estimated Value: $499,086 - $580,000
3
Beds
1
Bath
1,706
Sq Ft
$311/Sq Ft
Est. Value
About This Home
This home is located at 109 Bache Place, Dunellen, NJ 08812 and is currently estimated at $530,772, approximately $311 per square foot. 109 Bache Place is a home located in Middlesex County with nearby schools including John P. Faber Elementary School, Lincoln Middle School, and Dunellen High School.
Ownership History
Date
Name
Owned For
Owner Type
Purchase Details
Closed on
Oct 18, 2013
Sold by
Federal Home Loan Mortgage Corporation
Bought by
Chambers Birdia
Current Estimated Value
Home Financials for this Owner
Home Financials are based on the most recent Mortgage that was taken out on this home.
Original Mortgage
$187,600
Outstanding Balance
$140,197
Interest Rate
4.36%
Mortgage Type
New Conventional
Estimated Equity
$390,575
Purchase Details
Closed on
Oct 11, 2012
Sold by
Kosch Robert
Bought by
Kosch Robert
Purchase Details
Closed on
Sep 17, 2012
Sold by
Cassidy Michael V
Bought by
Floaters Llc
Purchase Details
Closed on
Aug 28, 2000
Sold by
Gettig Paul
Bought by
Cassidy Michael and Cassidy Suzanne
Home Financials for this Owner
Home Financials are based on the most recent Mortgage that was taken out on this home.
Original Mortgage
$139,900
Interest Rate
8.07%
Create a Home Valuation Report for This Property
The Home Valuation Report is an in-depth analysis detailing your home's value as well as a comparison with similar homes in the area
Home Values in the Area
Average Home Value in this Area
Purchase History
| Date | Buyer | Sale Price | Title Company |
|---|---|---|---|
| Chambers Birdia | $197,500 | Multiple | |
| Kosch Robert | -- | None Available | |
| Floaters Llc | $100,000 | None Available | |
| Floaters Llc | -- | None Available | |
| Cassidy Michael | $174,500 | -- |
Source: Public Records
Mortgage History
| Date | Status | Borrower | Loan Amount |
|---|---|---|---|
| Open | Chambers Birdia | $187,600 | |
| Previous Owner | Cassidy Michael | $139,900 |
Source: Public Records
Tax History Compared to Growth
Tax History
| Year | Tax Paid | Tax Assessment Tax Assessment Total Assessment is a certain percentage of the fair market value that is determined by local assessors to be the total taxable value of land and additions on the property. | Land | Improvement |
|---|---|---|---|---|
| 2025 | $11,454 | $499,100 | $94,800 | $404,300 |
| 2024 | $11,003 | $456,700 | $94,800 | $361,900 |
| 2023 | $11,003 | $406,300 | $94,800 | $311,500 |
| 2022 | $9,840 | $356,400 | $94,800 | $261,600 |
| 2021 | $9,467 | $304,600 | $94,800 | $209,800 |
| 2020 | $8,507 | $261,900 | $89,900 | $172,000 |
| 2019 | $8,127 | $261,900 | $89,900 | $172,000 |
| 2018 | $9,022 | $66,800 | $20,300 | $46,500 |
| 2017 | $8,657 | $66,800 | $20,300 | $46,500 |
| 2016 | $8,341 | $66,800 | $20,300 | $46,500 |
| 2015 | $8,134 | $66,800 | $20,300 | $46,500 |
| 2014 | $7,961 | $66,800 | $20,300 | $46,500 |
Source: Public Records
Map
Nearby Homes
- 261 New Market Rd
- 323 Oak Pkwy
- 250 Whittier Ave
- 203 Walnut St
- 417 Valmere Ave
- 400 Whittier Ave
- 220 S Washington Ave
- 325 Orange St
- 511 Grove St
- 423 New Market Rd
- 118 Jadach Dr
- 203 S Washington Ave
- 456 Valmere Ave
- 202 Prospect Ave
- 233 Maple Ave
- 1866 W 7th St
- 12 Buchman St
- 309-311 Pulaski St
- 577 S South Ave S
- 113 Bache Place
- 105 Bache Place
- 101 Bache Place
- 117 Bache Place
- 106 Bache Place
- 110 Bache Place
- 333 New Market Rd
- 333 New Market Rd Unit 2
- 333 New Market Rd Unit 1
- 114 Bache Place
- 327 New Market Rd
- 347 Haight St
- 121 Bache Place
- 321 New Market Rd
- 339 New Market Rd
- 118 Bache Place
- 343 New Market Rd
- 315 New Market Rd
- 36 Haight St
- 36 Haight St Unit 2