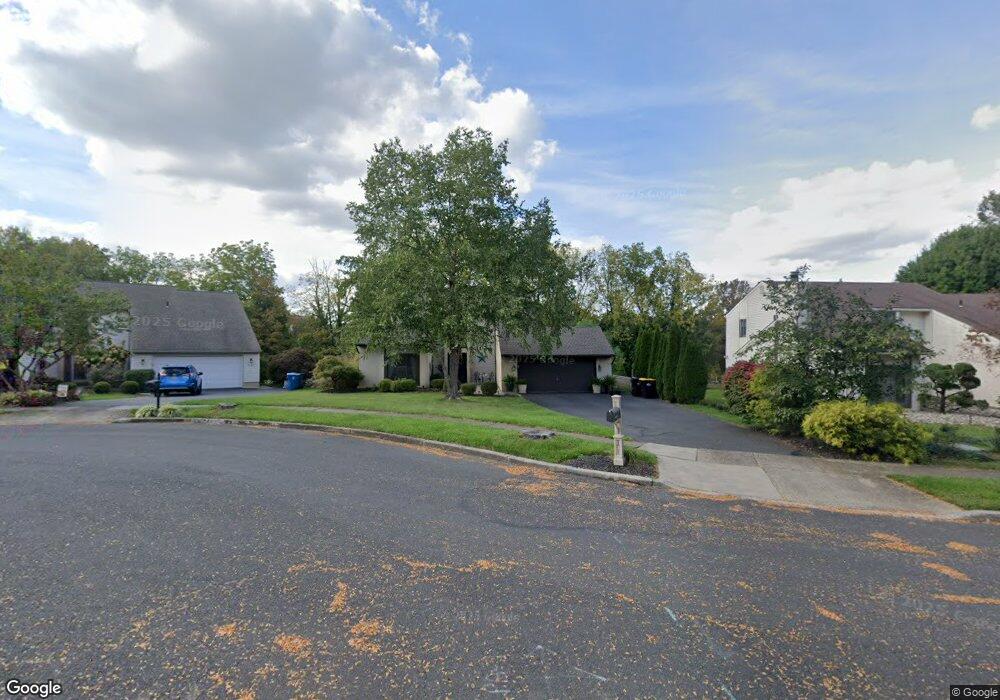
109 Belle View Way Chalfont, PA 18914
Estimated Value: $619,906 - $727,000
3
Beds
3
Baths
2,444
Sq Ft
$280/Sq Ft
Est. Value
About This Home
This home is located at 109 Belle View Way, Chalfont, PA 18914 and is currently estimated at $683,477, approximately $279 per square foot. 109 Belle View Way is a home located in Bucks County with nearby schools including Simon Butler Elementary, Unami Middle School, and Central Bucks High School - South.
Ownership History
Date
Name
Owned For
Owner Type
Purchase Details
Closed on
Jul 13, 2007
Sold by
Wexler Pattie F
Bought by
Gruber Michael J and Gruber Lisa
Current Estimated Value
Home Financials for this Owner
Home Financials are based on the most recent Mortgage that was taken out on this home.
Original Mortgage
$285,000
Interest Rate
6.78%
Mortgage Type
Purchase Money Mortgage
Purchase Details
Closed on
Jul 5, 2001
Sold by
Deery Jacob B and Deery Lisa A
Bought by
Wexler Pattie F
Home Financials for this Owner
Home Financials are based on the most recent Mortgage that was taken out on this home.
Original Mortgage
$130,000
Interest Rate
6.99%
Mortgage Type
Balloon
Purchase Details
Closed on
Aug 28, 1997
Sold by
Wirth Kathleen E and Wirth Andrew C
Bought by
Deery Jacob R and Deery Lisa A
Home Financials for this Owner
Home Financials are based on the most recent Mortgage that was taken out on this home.
Original Mortgage
$171,700
Interest Rate
7.36%
Create a Home Valuation Report for This Property
The Home Valuation Report is an in-depth analysis detailing your home's value as well as a comparison with similar homes in the area
Home Values in the Area
Average Home Value in this Area
Purchase History
| Date | Buyer | Sale Price | Title Company |
|---|---|---|---|
| Gruber Michael J | $460,000 | None Available | |
| Wexler Pattie F | $234,000 | -- | |
| Deery Jacob R | $190,800 | -- |
Source: Public Records
Mortgage History
| Date | Status | Borrower | Loan Amount |
|---|---|---|---|
| Previous Owner | Gruber Michael J | $285,000 | |
| Previous Owner | Wexler Pattie F | $130,000 | |
| Previous Owner | Deery Jacob R | $171,700 | |
| Closed | Wexler Pattie F | $105,000 |
Source: Public Records
Tax History Compared to Growth
Tax History
| Year | Tax Paid | Tax Assessment Tax Assessment Total Assessment is a certain percentage of the fair market value that is determined by local assessors to be the total taxable value of land and additions on the property. | Land | Improvement |
|---|---|---|---|---|
| 2025 | $7,002 | $40,400 | $4,560 | $35,840 |
| 2024 | $7,002 | $40,400 | $4,560 | $35,840 |
| 2023 | $6,779 | $40,400 | $4,560 | $35,840 |
| 2022 | $6,645 | $40,400 | $4,560 | $35,840 |
| 2021 | $6,570 | $40,400 | $4,560 | $35,840 |
| 2020 | $6,570 | $40,400 | $4,560 | $35,840 |
| 2019 | $6,489 | $40,400 | $4,560 | $35,840 |
| 2018 | $6,489 | $40,400 | $4,560 | $35,840 |
| 2017 | $6,438 | $40,400 | $4,560 | $35,840 |
| 2016 | $6,438 | $40,400 | $4,560 | $35,840 |
| 2015 | -- | $40,400 | $4,560 | $35,840 |
| 2014 | -- | $40,400 | $4,560 | $35,840 |
Source: Public Records
Map
Nearby Homes
- 0 S Limekiln Pike
- 202 Cornwall Dr
- 108 Devon Rd
- 245 Prince William Way
- 103 Bonnie Lark Ct
- 109 Suffield Ct
- 154 Galway Cir
- 117 S Limekiln Pike
- 113 Krista Ct
- 434 Reagans Ln
- 401 Reagans Ln
- 428 Reagans Ln
- 427 Reagans Ln
- 405 Reagans Ln
- 458 Reagans Ln
- 431 Reagans Ln
- 435 Reagans Ln
- 456 Regans Ln
- 437 Reagans Ln
- 259 Foxhedge Rd
- 107 Belle View Way
- 111 Belle View Way
- 105 Belle View Way
- 113 Belle View Way
- 106 Belle View Way
- 108 Belle View Way
- 103 Belle View Way
- 104 Belle View Way
- 100 Blackburn Dr
- 112 Belle View Way
- 110 Belle View Way
- 88 Woodside Ave
- 102 Belle View Way
- 102 Blackburn Dr
- 101 Belle View Way
- 100 Belle View Way
- 52 Clearview Ave
- 104 Blackburn Dr
- 46 Clearview Ave
- 58 Clearview Ave