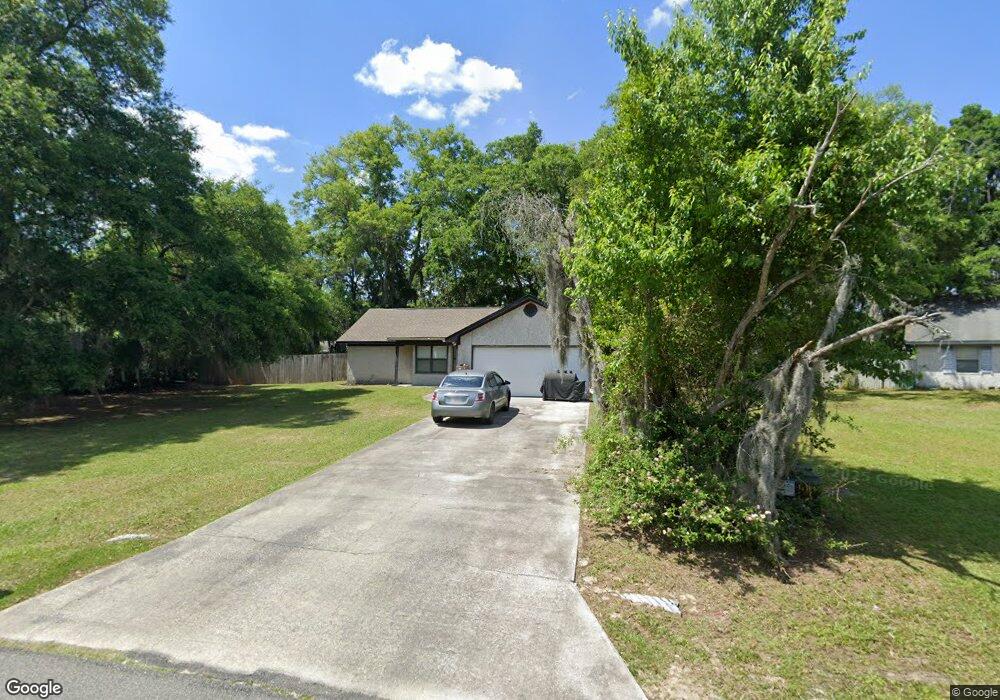
109 Bellvue Ct Saint Marys, GA 31558
Estimated Value: $252,065 - $259,000
3
Beds
2
Baths
1,312
Sq Ft
$195/Sq Ft
Est. Value
About This Home
This home is located at 109 Bellvue Ct, Saint Marys, GA 31558 and is currently estimated at $255,516, approximately $194 per square foot. 109 Bellvue Ct is a home located in Camden County with nearby schools including Sugarmill Elementary School, Saint Marys Middle School, and Camden County High School.
Ownership History
Date
Name
Owned For
Owner Type
Purchase Details
Closed on
Oct 31, 2006
Sold by
Not Provided
Bought by
Jones Nathan T
Current Estimated Value
Home Financials for this Owner
Home Financials are based on the most recent Mortgage that was taken out on this home.
Original Mortgage
$122,580
Outstanding Balance
$72,670
Interest Rate
6.25%
Mortgage Type
VA
Estimated Equity
$182,846
Create a Home Valuation Report for This Property
The Home Valuation Report is an in-depth analysis detailing your home's value as well as a comparison with similar homes in the area
Home Values in the Area
Average Home Value in this Area
Purchase History
| Date | Buyer | Sale Price | Title Company |
|---|---|---|---|
| Jones Nathan T | $120,000 | -- |
Source: Public Records
Mortgage History
| Date | Status | Borrower | Loan Amount |
|---|---|---|---|
| Open | Jones Nathan T | $122,580 |
Source: Public Records
Tax History Compared to Growth
Tax History
| Year | Tax Paid | Tax Assessment Tax Assessment Total Assessment is a certain percentage of the fair market value that is determined by local assessors to be the total taxable value of land and additions on the property. | Land | Improvement |
|---|---|---|---|---|
| 2024 | $3,235 | $94,046 | $12,000 | $82,046 |
| 2023 | $2,557 | $72,069 | $10,000 | $62,069 |
| 2022 | $1,795 | $61,381 | $10,000 | $51,381 |
| 2021 | $1,700 | $54,992 | $10,000 | $44,992 |
| 2020 | $1,426 | $44,867 | $10,000 | $34,867 |
| 2019 | $1,426 | $44,867 | $10,000 | $34,867 |
| 2018 | $292 | $44,867 | $10,000 | $34,867 |
| 2017 | $1,103 | $36,723 | $4,800 | $31,923 |
| 2016 | $1,015 | $33,893 | $4,800 | $29,093 |
| 2015 | $983 | $33,892 | $4,800 | $29,093 |
| 2014 | $978 | $33,893 | $4,800 | $29,093 |
Source: Public Records
Map
Nearby Homes
- 102 Bellvue Ct
- 107 Sunnyside Dr
- 308 Pinedale Dr
- 102 Pinedale Dr
- 115 Pinedale Dr
- 404 Westgate Cir
- 116 Dogwood Cir
- 131 Cherry Point Dr
- 51 Silver Fox Dr
- 105 Courtland Dr
- 159 Courtland Dr
- 240 Courtland Dr
- 137 Courtland Dr
- 201 Tidal Marsh Way
- 145 Fairfield Dr
- 395 Silver Fox Dr
- 378 Silver Fox Dr
- 0 Charlie Smith Sr Hwy Unit 1654326
- 0 Charlie Smith Sr Hwy Unit 10533024
- 126 Courtland Dr
- 107 Bellvue Ct
- 111 Bellvue Ct
- 508 Sunnyside Ct
- 506 Sunnyside Ct
- 510 Sunnyside Ct
- 504 Sunnyside Ct
- 106 Bellvue Ct
- 105 Bellvue Ct
- 512 Sunnyside Ct
- 512 Sunnyside Ct Unit 1
- 113 Bellvue Ct
- 0 Sunnyside Ct Unit 7453849
- 0 Sunnyside Ct Unit 7479718
- 0 Sunnyside Ct Unit 7175057
- 0 Sunnyside Ct Unit 7142412
- 0 Sunnyside Ct Unit 7047721
- 0 Sunnyside Ct Unit 7012592
- 0 Sunnyside Ct Unit 7511305
- 0 Sunnyside Ct Unit 7178019
- 0 Sunnyside Ct Unit 3130946