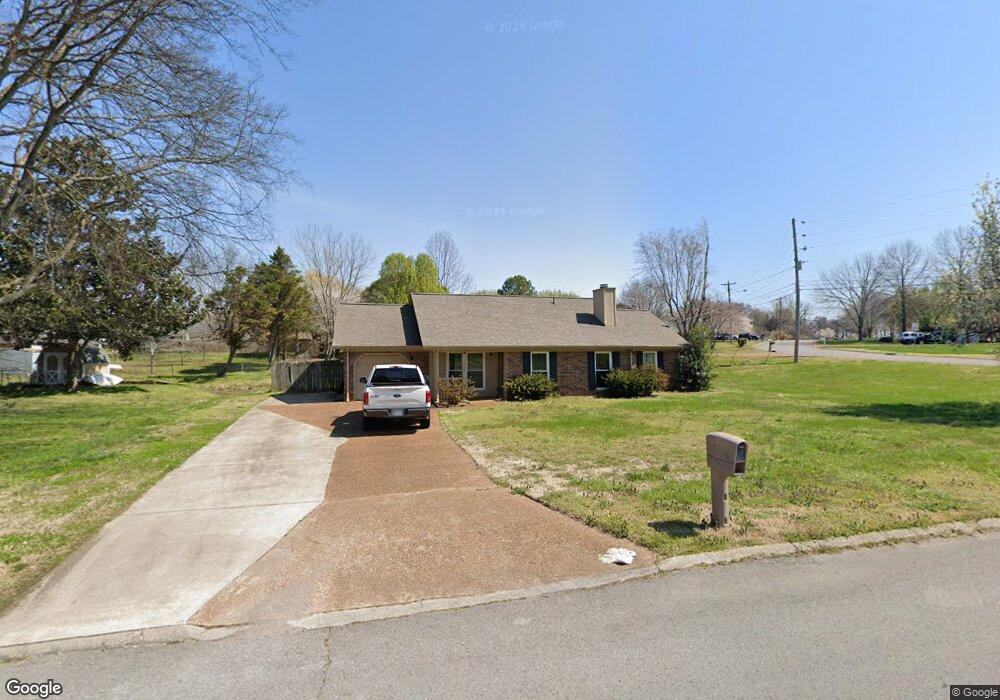
109 Bent Tree Dr Smyrna, TN 37167
Estimated Value: $276,000 - $372,000
--
Bed
2
Baths
1,275
Sq Ft
$260/Sq Ft
Est. Value
About This Home
This home is located at 109 Bent Tree Dr, Smyrna, TN 37167 and is currently estimated at $330,886, approximately $259 per square foot. 109 Bent Tree Dr is a home located in Rutherford County with nearby schools including Smyrna Elementary School, Smyrna Middle School, and Smyrna High School.
Ownership History
Date
Name
Owned For
Owner Type
Purchase Details
Closed on
Sep 21, 2010
Sold by
Menjivar Odir Serrano
Bought by
Barnes Clifton B
Current Estimated Value
Home Financials for this Owner
Home Financials are based on the most recent Mortgage that was taken out on this home.
Original Mortgage
$108,439
Outstanding Balance
$71,351
Interest Rate
4.37%
Mortgage Type
FHA
Estimated Equity
$259,535
Purchase Details
Closed on
Dec 5, 2006
Sold by
Tapperson Kevin G
Bought by
Serrano Menijvar Odir
Home Financials for this Owner
Home Financials are based on the most recent Mortgage that was taken out on this home.
Original Mortgage
$108,700
Interest Rate
6.31%
Purchase Details
Closed on
Nov 19, 2004
Sold by
Ward Jason T
Bought by
Tapperson Kevin G and Tapperson Nicole D
Home Financials for this Owner
Home Financials are based on the most recent Mortgage that was taken out on this home.
Original Mortgage
$117,250
Interest Rate
5.6%
Purchase Details
Closed on
Mar 22, 1999
Sold by
Vida Frederick E
Bought by
Ward Jason T
Create a Home Valuation Report for This Property
The Home Valuation Report is an in-depth analysis detailing your home's value as well as a comparison with similar homes in the area
Home Values in the Area
Average Home Value in this Area
Purchase History
| Date | Buyer | Sale Price | Title Company |
|---|---|---|---|
| Barnes Clifton B | $109,900 | -- | |
| Serrano Menijvar Odir | $135,900 | -- | |
| Tapperson Kevin G | $120,900 | -- | |
| Ward Jason T | $103,000 | -- |
Source: Public Records
Mortgage History
| Date | Status | Borrower | Loan Amount |
|---|---|---|---|
| Open | Ward Jason T | $108,439 | |
| Previous Owner | Ward Jason T | $108,700 | |
| Previous Owner | Ward Jason T | $27,200 | |
| Previous Owner | Ward Jason T | $117,250 |
Source: Public Records
Tax History Compared to Growth
Tax History
| Year | Tax Paid | Tax Assessment Tax Assessment Total Assessment is a certain percentage of the fair market value that is determined by local assessors to be the total taxable value of land and additions on the property. | Land | Improvement |
|---|---|---|---|---|
| 2025 | $1,517 | $63,150 | $13,750 | $49,400 |
| 2024 | $1,517 | $63,150 | $13,750 | $49,400 |
| 2023 | $1,517 | $63,150 | $13,750 | $49,400 |
| 2022 | $1,353 | $63,150 | $13,750 | $49,400 |
| 2021 | $1,367 | $46,800 | $10,625 | $36,175 |
| 2020 | $1,367 | $46,800 | $10,625 | $36,175 |
| 2019 | $1,367 | $46,800 | $10,625 | $36,175 |
| 2018 | $1,311 | $46,800 | $0 | $0 |
| 2017 | $1,198 | $33,625 | $0 | $0 |
| 2016 | $1,198 | $33,625 | $0 | $0 |
| 2015 | $1,198 | $33,625 | $0 | $0 |
| 2014 | $836 | $33,625 | $0 | $0 |
| 2013 | -- | $33,575 | $0 | $0 |
Source: Public Records
Map
Nearby Homes
- 1655 Ben Johns Rd
- 307 Andy Johns Dr
- 610 Virginia Belle Dr
- 314 Lake Farm Rd
- 411 Lake Farm Rd
- 517 Matthew Miller Dr
- 415 Lawson Rd
- 601 Mary Alice Dr
- 416 Lawson Rd
- 111 Brandon Trail
- 402 Holston Dr
- 112 Lakewood Cir
- 401 Ravencliff Ct
- 610 Winthrop Ave
- 512 Holston Dr
- 313 Mayfield Dr
- 307 Dartford Ct
- 100 Halfrunner Way Unit 1
- 102 Halfrunner Way Unit 2
- 104 Halfrunner Way Unit 3
- 555 Highpoint Dr
- 107 Bent Tree Dr
- 108 Bent Tree Dr
- 308 Sussex St
- 557 Highpoint Dr
- 550 Highpoint Dr
- 106 Bent Tree Dr
- 552 Highpoint Dr
- 310 Sussex St
- 548 Highpoint Dr
- 559 Highpoint Dr
- 200 Woodshire Dr
- 402 Adeline Dr
- 302 Sussex Ct
- 105 Bent Tree Dr
- 400 Adeline Dr
- 203 Bayhill Ct
- 309 Sussex St
- 202 Woodshire Dr
- 547 Highpoint Dr