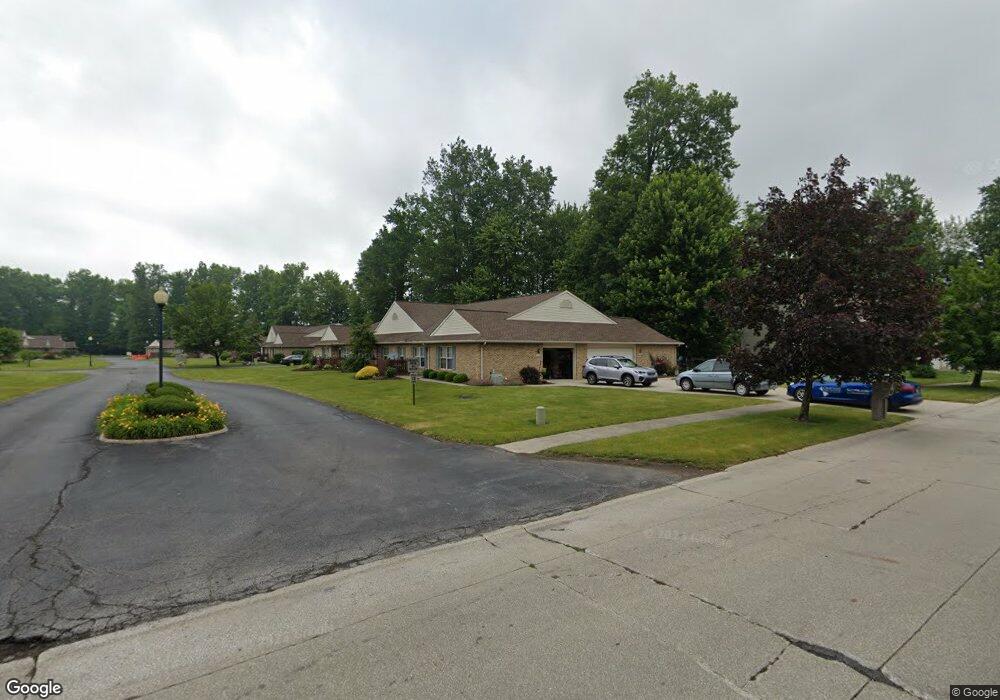
109 Bentley Dr Unit 7 Elyria, OH 44035
Estimated Value: $193,000 - $217,000
2
Beds
2
Baths
1,266
Sq Ft
$162/Sq Ft
Est. Value
About This Home
This home is located at 109 Bentley Dr Unit 7, Elyria, OH 44035 and is currently estimated at $204,763, approximately $161 per square foot. 109 Bentley Dr Unit 7 is a home located in Lorain County with nearby schools including Eastern Heights Middle School, Elyria High School, and Constellation Schools: Elyria Community Elementary.
Ownership History
Date
Name
Owned For
Owner Type
Purchase Details
Closed on
Sep 16, 2015
Sold by
Gard Denise and Lear Darlene
Bought by
Reck Jack J and Reck Wilma M
Current Estimated Value
Home Financials for this Owner
Home Financials are based on the most recent Mortgage that was taken out on this home.
Original Mortgage
$78,850
Outstanding Balance
$61,910
Interest Rate
3.9%
Mortgage Type
New Conventional
Estimated Equity
$142,853
Purchase Details
Closed on
Sep 23, 2005
Sold by
Drahan Steven A
Bought by
Holtwick Richard R and The Richard R Holtwick Revocable Living
Purchase Details
Closed on
Jan 30, 2000
Sold by
Kemble Herbert A Trustee
Bought by
Salvador Patricia
Home Financials for this Owner
Home Financials are based on the most recent Mortgage that was taken out on this home.
Original Mortgage
$43,000
Interest Rate
7.84%
Create a Home Valuation Report for This Property
The Home Valuation Report is an in-depth analysis detailing your home's value as well as a comparison with similar homes in the area
Home Values in the Area
Average Home Value in this Area
Purchase History
| Date | Buyer | Sale Price | Title Company |
|---|---|---|---|
| Reck Jack J | $83,000 | Northshore Title Agency | |
| Holtwick Richard R | $129,500 | Elyria Title | |
| Salvador Patricia | $114,900 | Midland Title |
Source: Public Records
Mortgage History
| Date | Status | Borrower | Loan Amount |
|---|---|---|---|
| Open | Reck Jack J | $78,850 | |
| Previous Owner | Salvador Patricia | $43,000 |
Source: Public Records
Tax History
| Year | Tax Paid | Tax Assessment Tax Assessment Total Assessment is a certain percentage of the fair market value that is determined by local assessors to be the total taxable value of land and additions on the property. | Land | Improvement |
|---|---|---|---|---|
| 2024 | $2,347 | $59,388 | $9,363 | $50,026 |
| 2023 | $1,588 | $38,304 | $7,707 | $30,597 |
| 2022 | $1,605 | $38,304 | $7,707 | $30,597 |
| 2021 | $1,609 | $38,304 | $7,707 | $30,597 |
| 2020 | $1,593 | $34,790 | $7,000 | $27,790 |
| 2019 | $1,583 | $34,790 | $7,000 | $27,790 |
| 2018 | $1,586 | $34,790 | $7,000 | $27,790 |
| 2017 | $1,567 | $33,410 | $6,760 | $26,650 |
| 2016 | $2,095 | $33,410 | $6,760 | $26,650 |
| 2015 | $1,449 | $33,410 | $6,760 | $26,650 |
| 2014 | $1,500 | $34,590 | $7,000 | $27,590 |
| 2013 | $1,486 | $34,590 | $7,000 | $27,590 |
Source: Public Records
Map
Nearby Homes
- 154 Bentley Dr
- 217 Syracuse Ct
- 832 S Logan St
- 828 S Logan St
- 239 Syracuse Ct
- 459 Auburn St
- 128 Richmond Ct
- 800 Boston Ave
- 134 Richmond Ct
- 560 Case Ave
- 475 Carol Ln
- 418 Carol Ln
- 715 Carol Ln
- 523 Purdue Ave
- 340 Boston Ave
- 1210 Prospect St
- 158 Stonecrest Trail
- 134 California Ave
- 124 Oakley Green Dr
- 157 Stonecrest Trail
- 107 Bentley Dr Unit 6107
- 105 Bentley Dr Unit 8
- 103 Bentley Dr Unit 5
- 121 Bentley Dr Unit 16
- 119 Bentley Dr Unit 13
- 110 Bentley Dr Unit 3
- 106 Bentley Dr Unit 4
- 125 Bentley Dr
- 123 Bentley Dr
- 104 Bentley Dr Unit 1
- 108 Bentley Dr Unit 2
- 122 Bentley Dr Unit 12
- 120 Bentley Dr Unit 9
- 309 Oakdale Cir
- 126 Bentley Dr Unit 11
- 124 Bentley Dr Unit 10
- 214 Oakdale Cir
- 133 Bentley Dr Unit 21
- 100 Driftwood Ct
- 135 Bentley Dr Unit 24
Your Personal Tour Guide
Ask me questions while you tour the home.