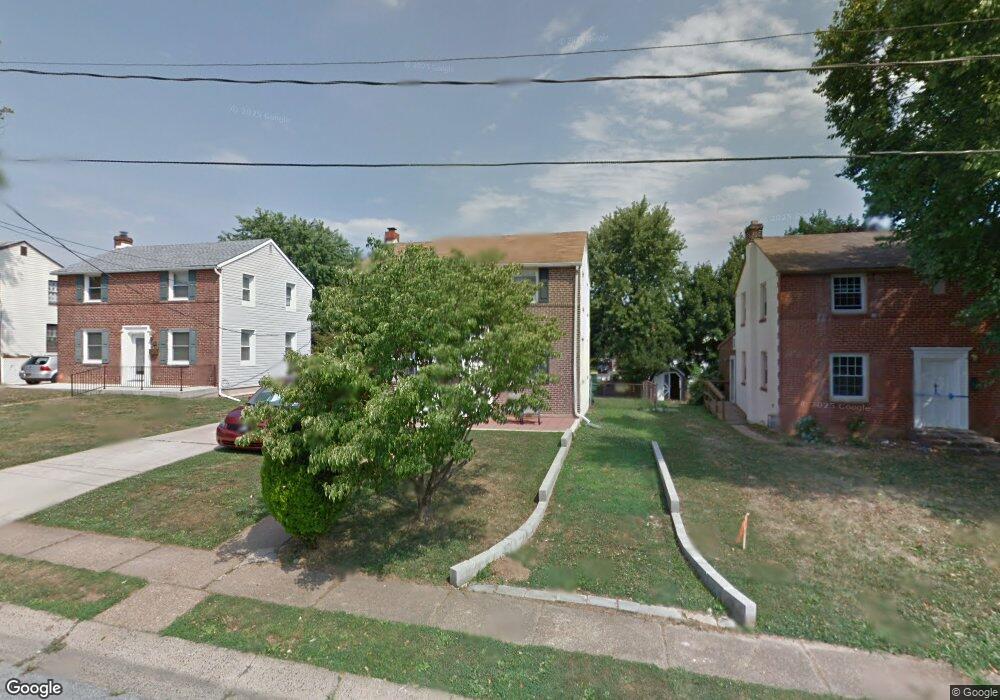
109 Buck Ln New Castle, DE 19720
Estimated Value: $264,000 - $284,000
3
Beds
1
Bath
1,232
Sq Ft
$220/Sq Ft
Est. Value
About This Home
This home is located at 109 Buck Ln, New Castle, DE 19720 and is currently estimated at $271,456, approximately $220 per square foot. 109 Buck Ln is a home located in New Castle County with nearby schools including New Castle Elementary School, Calvin R. McCullough Middle School, and Charter School of New Castle.
Ownership History
Date
Name
Owned For
Owner Type
Purchase Details
Closed on
Oct 23, 2006
Sold by
Ferriera Leandro
Bought by
Castro Juan Carlos
Current Estimated Value
Purchase Details
Closed on
Aug 9, 2002
Sold by
White Donna and Gower William E
Bought by
Ferriera Leandro
Home Financials for this Owner
Home Financials are based on the most recent Mortgage that was taken out on this home.
Original Mortgage
$104,500
Interest Rate
6.61%
Create a Home Valuation Report for This Property
The Home Valuation Report is an in-depth analysis detailing your home's value as well as a comparison with similar homes in the area
Home Values in the Area
Average Home Value in this Area
Purchase History
| Date | Buyer | Sale Price | Title Company |
|---|---|---|---|
| Castro Juan Carlos | $167,000 | None Available | |
| Ferriera Leandro | $104,500 | -- |
Source: Public Records
Mortgage History
| Date | Status | Borrower | Loan Amount |
|---|---|---|---|
| Previous Owner | Ferriera Leandro | $104,500 | |
| Closed | Ferriera Leandro | $5,000 |
Source: Public Records
Tax History Compared to Growth
Tax History
| Year | Tax Paid | Tax Assessment Tax Assessment Total Assessment is a certain percentage of the fair market value that is determined by local assessors to be the total taxable value of land and additions on the property. | Land | Improvement |
|---|---|---|---|---|
| 2024 | $1,208 | $35,200 | $5,100 | $30,100 |
| 2023 | $1,099 | $35,200 | $5,100 | $30,100 |
| 2022 | $1,144 | $35,200 | $5,100 | $30,100 |
| 2021 | $1,144 | $35,200 | $5,100 | $30,100 |
| 2020 | $1,151 | $35,200 | $5,100 | $30,100 |
| 2019 | $1,800 | $35,200 | $5,100 | $30,100 |
| 2018 | $1,128 | $35,200 | $5,100 | $30,100 |
| 2017 | $1,055 | $35,200 | $5,100 | $30,100 |
| 2016 | $944 | $35,200 | $5,100 | $30,100 |
| 2015 | $944 | $35,200 | $5,100 | $30,100 |
| 2014 | $945 | $35,200 | $5,100 | $30,100 |
Source: Public Records
Map
Nearby Homes