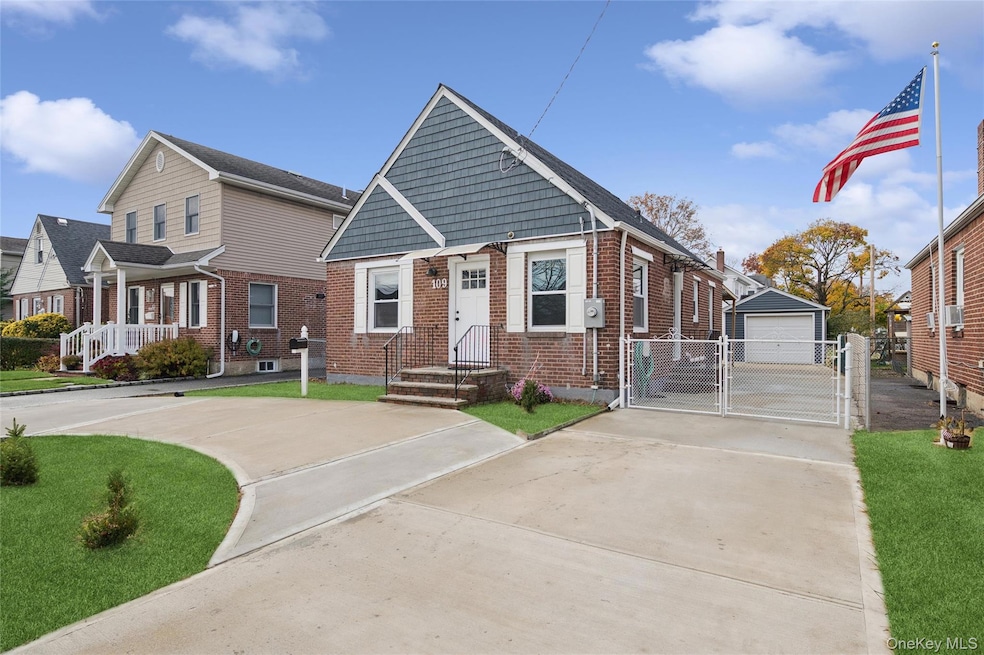
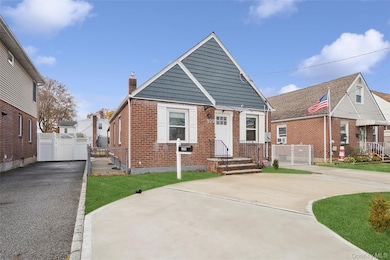
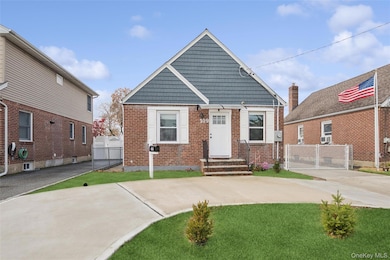
109 Caroline Ave Franklin Square, NY 11010
Estimated payment $5,167/month
Highlights
- Cape Cod Architecture
- Wood Flooring
- Granite Countertops
- Cathedral Ceiling
- Main Floor Bedroom
- Breakfast Area or Nook
About This Home
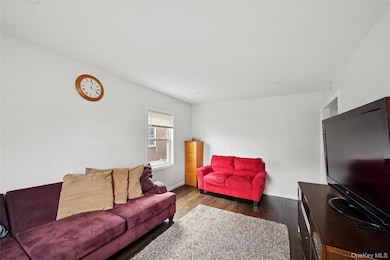
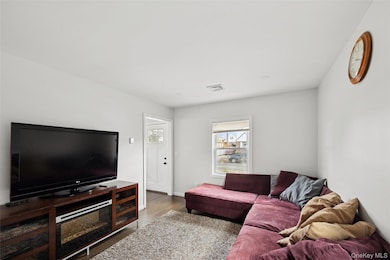
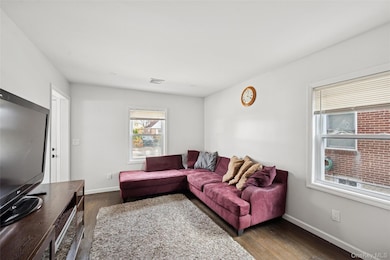
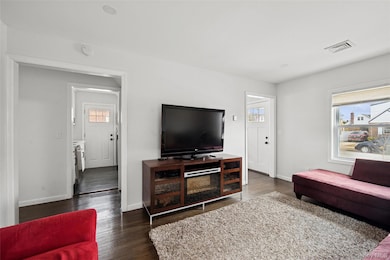
Beautifully Renovated Cape Cod Home on a mid block location. This home is a delightful residence nestled in a picturesque neighborhood. This elegant home offers a blend of modern comfort and classic style, providing a welcoming atmosphere for everyone. Enter into an inviting cozy space featuring a sunlit living area with pristine hardwood floors and high ceilings. This new kitchen, complete with new appliances, granite countertops, and a cozy breakfast nook.
The primary suite boasts a generous closet and a luxurious en-suite bathroom with a soaking tub and glass-enclosed shower. Additional bedrooms are equally inviting, offering ample space and natural light.
Schools, shopping, and dining all close by, this home ensures convenience and tranquility. Experience the best of suburban living at 109 Caroline Franklin Square—a true gem waiting for you to call home.
Listing Agent
Douglas Elliman Real Estate Brokerage Phone: 347-386-6932 License #10401274814 Listed on: 11/19/2025

Open House Schedule
-
Sunday, November 23, 202512:00 to 2:00 pm11/23/2025 12:00:00 PM +00:0011/23/2025 2:00:00 PM +00:00Add to Calendar
Home Details
Home Type
- Single Family
Est. Annual Taxes
- $11,369
Year Built
- Built in 1943 | Remodeled in 2023
Lot Details
- 4,080 Sq Ft Lot
- Back Yard Fenced
Parking
- 1 Car Garage
- Driveway
Home Design
- Cape Cod Architecture
- Brick Exterior Construction
- Vinyl Siding
Interior Spaces
- 1,142 Sq Ft Home
- Cathedral Ceiling
- Recessed Lighting
- New Windows
- Wood Flooring
- Dryer
Kitchen
- Breakfast Area or Nook
- Eat-In Kitchen
- Gas Oven
- Cooktop
- Microwave
- Dishwasher
- Granite Countertops
Bedrooms and Bathrooms
- 3 Bedrooms
- Main Floor Bedroom
- En-Suite Primary Bedroom
- Bathroom on Main Level
- 3 Full Bathrooms
- Soaking Tub
Basement
- Walk-Out Basement
- Laundry in Basement
Schools
- Washington Street Elementary School
- H Frank Carey High Middle School
- H Frank Carey High School
Utilities
- Forced Air Heating and Cooling System
- Natural Gas Connected
- Gas Water Heater
Listing and Financial Details
- Assessor Parcel Number 2089-33-597-00-0148-0
Map
Home Values in the Area
Average Home Value in this Area
Tax History
| Year | Tax Paid | Tax Assessment Tax Assessment Total Assessment is a certain percentage of the fair market value that is determined by local assessors to be the total taxable value of land and additions on the property. | Land | Improvement |
|---|---|---|---|---|
| 2025 | $10,795 | $491 | $250 | $241 |
| 2024 | $4,417 | $491 | $250 | $241 |
| 2023 | $11,369 | $491 | $250 | $241 |
| 2022 | $11,369 | $491 | $250 | $241 |
| 2021 | $9,316 | $482 | $245 | $237 |
| 2020 | $6,088 | $541 | $473 | $68 |
| 2019 | $3,108 | $579 | $474 | $105 |
| 2018 | $2,987 | $618 | $0 | $0 |
| 2017 | $3,132 | $645 | $506 | $139 |
| 2016 | $6,413 | $645 | $411 | $234 |
| 2015 | $3,074 | $681 | $433 | $248 |
| 2014 | $3,074 | $681 | $433 | $248 |
| 2013 | $3,341 | $795 | $506 | $289 |
Property History
| Date | Event | Price | List to Sale | Price per Sq Ft |
|---|---|---|---|---|
| 11/20/2025 11/20/25 | For Sale | $799,000 | -- | $700 / Sq Ft |
Purchase History
| Date | Type | Sale Price | Title Company |
|---|---|---|---|
| Bargain Sale Deed | $630,000 | First American Title Ins Co | |
| Bargain Sale Deed | $630,000 | First American Title Ins Co | |
| Bargain Sale Deed | $630,000 | First American Title Ins Co | |
| Bargain Sale Deed | $630,000 | First American Title Ins Co | |
| Deed | $455,000 | None Available | |
| Deed | $455,000 | None Available | |
| Deed | $455,000 | None Available | |
| Bargain Sale Deed | -- | None Available | |
| Bargain Sale Deed | -- | None Available | |
| Bargain Sale Deed | -- | None Available | |
| Bargain Sale Deed | -- | -- | |
| Bargain Sale Deed | -- | -- | |
| Bargain Sale Deed | -- | -- |
Mortgage History
| Date | Status | Loan Amount | Loan Type |
|---|---|---|---|
| Open | $451,000 | New Conventional | |
| Closed | $451,000 | New Conventional | |
| Previous Owner | $479,850 | Commercial |
Source: OneKey® MLS
MLS Number: 937543
APN: 2089-33-597-00-0148-0
Disclaimer: Certain information contained herein is derived from information provided by parties other than Homes.com. All information provided is deemed reliable, but is not guaranteed to be accurate and should be independently verified.
![]() The data relating to real estate for sale or lease on this web site comes in part from OneKey® MLS. Real estate listings held by brokerage firms other than Ten-X are marked with the OneKey® MLS logo or an abbreviated logo and detailed information about them includes the name of the listing broker.
The data relating to real estate for sale or lease on this web site comes in part from OneKey® MLS. Real estate listings held by brokerage firms other than Ten-X are marked with the OneKey® MLS logo or an abbreviated logo and detailed information about them includes the name of the listing broker.
IDX information is provided exclusively for personal, non-commercial use, and may not be used for any purpose other than to identify prospective properties consumers may be interested in purchasing.
Information is deemed reliable but not guaranteed.
Copyright 2025 OneKey® MLS. All rights reserved.
- 146 Caroline Ave
- 715 Iris St
- 763 Roosevelt St
- 775 Roosevelt St
- 644 7th St S
- 170 Mckinley Ave
- 676 Sobo Ave
- 138 Lincoln Rd
- 217 Wellington Rd S
- 233 Roxbury Rd S
- 56 Fendale St
- 124 Kilburn Rd S
- 31 Claflin Blvd
- 234 Nassau Blvd
- 23 Monroe St
- 32 Madison Ave
- 115 Madison Ave
- 235 Lincoln Place
- 144 Rintin St
- 149 Rule St
- 30 Mckinley Ave Unit Upper Unit
- 281 Kilburn Rd S
- 772 Garden Dr
- 626 Wool Ave
- 2 Sunset Ln
- 20 Fairmount Blvd
- 1174 Russell St Unit Second Floor
- 23 Doris Ave
- 118 Sycamore St Unit LowerLevel
- 308 Lucille Ave Unit 2nd floor
- 308 Lucille Ave Unit 1
- 1016 Oaks Dr
- 111 Hempstead Turnpike
- 106 Hempstead Turnpike
- 6 Fernwood Terrace N
- 605-625 Tulip Ave