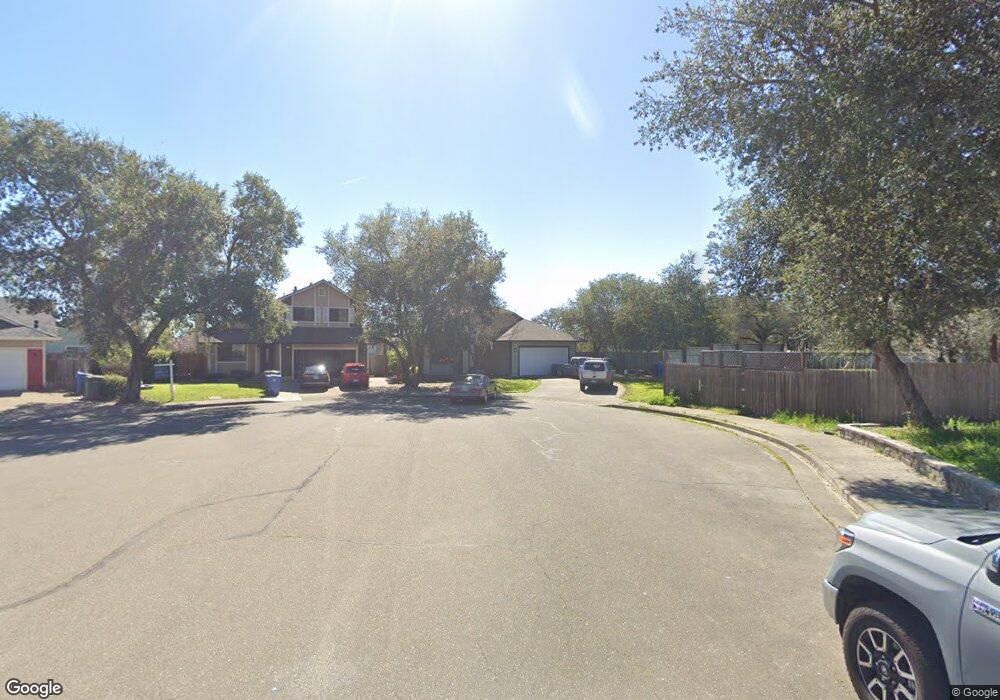
109 Cathy Ct Windsor, CA 95492
Estimated Value: $679,000 - $719,000
3
Beds
2
Baths
1,393
Sq Ft
$503/Sq Ft
Est. Value
About This Home
This home is located at 109 Cathy Ct, Windsor, CA 95492 and is currently estimated at $700,880, approximately $503 per square foot. 109 Cathy Ct is a home located in Sonoma County with nearby schools including Mattie Washburn Elementary School, Brooks Elementary School, and Windsor Middle School.
Ownership History
Date
Name
Owned For
Owner Type
Purchase Details
Closed on
Jan 24, 2020
Sold by
Fong Joshua Patrick and Fong Joshua
Bought by
Fong Joshua Patrick and Fong Matilda Jane Derrick
Current Estimated Value
Purchase Details
Closed on
Dec 22, 2006
Sold by
Fong Doris
Bought by
Fong Lincoln and Fong Joshua
Purchase Details
Closed on
Aug 23, 2006
Sold by
Fong Doris
Bought by
Fong Doris and Doris Fong 2006 Trust
Purchase Details
Closed on
Oct 19, 1989
Bought by
Fong Doris Tr Et Al
Create a Home Valuation Report for This Property
The Home Valuation Report is an in-depth analysis detailing your home's value as well as a comparison with similar homes in the area
Home Values in the Area
Average Home Value in this Area
Purchase History
| Date | Buyer | Sale Price | Title Company |
|---|---|---|---|
| Fong Joshua Patrick | -- | None Available | |
| Fong Lincoln | -- | None Available | |
| Fong Doris | -- | None Available | |
| Fong Doris | -- | None Available | |
| Fong Doris Tr Et Al | $148,500 | -- | |
| Fong Doris Tr Et Al | $148,500 | -- |
Source: Public Records
Tax History
| Year | Tax Paid | Tax Assessment Tax Assessment Total Assessment is a certain percentage of the fair market value that is determined by local assessors to be the total taxable value of land and additions on the property. | Land | Improvement |
|---|---|---|---|---|
| 2025 | $3,430 | $272,265 | $110,374 | $161,891 |
| 2024 | $3,430 | $266,927 | $108,210 | $158,717 |
| 2023 | $3,430 | $261,694 | $106,089 | $155,605 |
| 2022 | $3,311 | $256,563 | $104,009 | $152,554 |
| 2021 | $3,260 | $251,533 | $101,970 | $149,563 |
| 2020 | $3,328 | $248,955 | $100,925 | $148,030 |
| 2019 | $3,323 | $244,075 | $98,947 | $145,128 |
| 2018 | $3,278 | $239,290 | $97,007 | $142,283 |
| 2017 | $3,249 | $234,599 | $95,105 | $139,494 |
| 2016 | $3,070 | $230,000 | $93,241 | $136,759 |
| 2015 | $2,991 | $226,546 | $91,841 | $134,705 |
| 2014 | $2,948 | $222,109 | $90,042 | $132,067 |
Source: Public Records
Map
Nearby Homes
- 107 Bouquet Cir
- 772 Mcclelland Dr Unit U11
- 202 Johnson St Unit U14
- 191 Johnson St
- 185 Johnson St
- 125 Johnson St
- 9551 Old Redwood Hwy
- 8185 Old Redwood Hwy
- 3283 Upland Way
- 411 Walten Way
- 280 Decanter Cir
- 8596 Starr Rd
- 100 Wooded Glen Ct
- 7830 Foppiano Way
- 9131 Benny Goodman Way
- 129 Wooded Glen Ct
- 8182 Willow St
- 1138 Broadleaf Ln
- 9821 Dawn Way
- 8145 Willow St
Your Personal Tour Guide
Ask me questions while you tour the home.