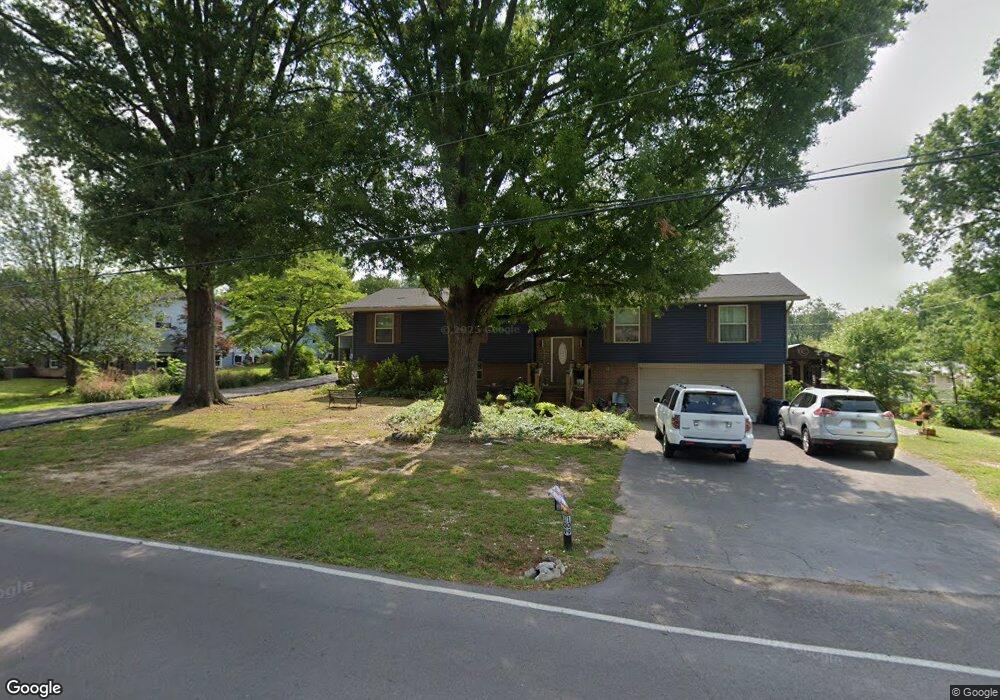
109 Chris Ln Chickamauga, GA 30707
Estimated Value: $329,000 - $389,000
3
Beds
2
Baths
1,664
Sq Ft
$209/Sq Ft
Est. Value
About This Home
This home is located at 109 Chris Ln, Chickamauga, GA 30707 and is currently estimated at $348,410, approximately $209 per square foot. 109 Chris Ln is a home located in Walker County with nearby schools including Chickamauga Elementary School, Gordon Lee Middle School, and Gordon Lee High School.
Ownership History
Date
Name
Owned For
Owner Type
Purchase Details
Closed on
Aug 11, 1997
Sold by
Cardiasmenos Ruby Kate
Bought by
Yates Michael L
Current Estimated Value
Purchase Details
Closed on
Jun 5, 1990
Sold by
Cardiasmenos Paul and Cardiasmenos Ruby K
Bought by
Cardiasmenos Ruby Kate
Purchase Details
Closed on
Apr 16, 1984
Sold by
Miller Frank H and Miller Ester
Bought by
Cardiasmenos Paul and Cardiasmenos Ruby K
Purchase Details
Closed on
Jan 25, 1983
Sold by
Merrill Lynch Relocation Man
Bought by
Miller Frank H and Miller Ester
Purchase Details
Closed on
Jul 20, 1981
Sold by
Williams John T and Wf Shirley
Bought by
Merrill Lynch Relocation Man
Purchase Details
Closed on
May 24, 1973
Sold by
Harold Parrish M and Harold Stoker
Bought by
Williams John T and Wf Shirley
Purchase Details
Closed on
Jan 1, 1972
Bought by
Harold Parrish M and Harold Stoker
Create a Home Valuation Report for This Property
The Home Valuation Report is an in-depth analysis detailing your home's value as well as a comparison with similar homes in the area
Home Values in the Area
Average Home Value in this Area
Purchase History
| Date | Buyer | Sale Price | Title Company |
|---|---|---|---|
| Yates Michael L | $87,900 | -- | |
| Cardiasmenos Ruby Kate | -- | -- | |
| Cardiasmenos Paul | -- | -- | |
| Miller Frank H | $43,500 | -- | |
| Merrill Lynch Relocation Man | $43,500 | -- | |
| Williams John T | -- | -- | |
| Harold Parrish M | -- | -- |
Source: Public Records
Tax History Compared to Growth
Tax History
| Year | Tax Paid | Tax Assessment Tax Assessment Total Assessment is a certain percentage of the fair market value that is determined by local assessors to be the total taxable value of land and additions on the property. | Land | Improvement |
|---|---|---|---|---|
| 2024 | $3,143 | $135,463 | $14,000 | $121,463 |
| 2023 | $3,085 | $128,969 | $14,000 | $114,969 |
| 2022 | $1,321 | $112,887 | $14,000 | $98,887 |
| 2021 | $863 | $60,310 | $14,000 | $46,310 |
| 2020 | $835 | $52,456 | $14,000 | $38,456 |
| 2019 | $835 | $52,456 | $14,000 | $38,456 |
| 2018 | $689 | $52,456 | $14,000 | $38,456 |
| 2017 | $982 | $50,776 | $12,320 | $38,456 |
| 2016 | $664 | $50,776 | $12,320 | $38,456 |
| 2015 | $728 | $53,873 | $10,400 | $43,473 |
| 2014 | $607 | $53,873 | $10,400 | $43,473 |
| 2013 | -- | $53,872 | $10,400 | $43,472 |
Source: Public Records
Map
Nearby Homes