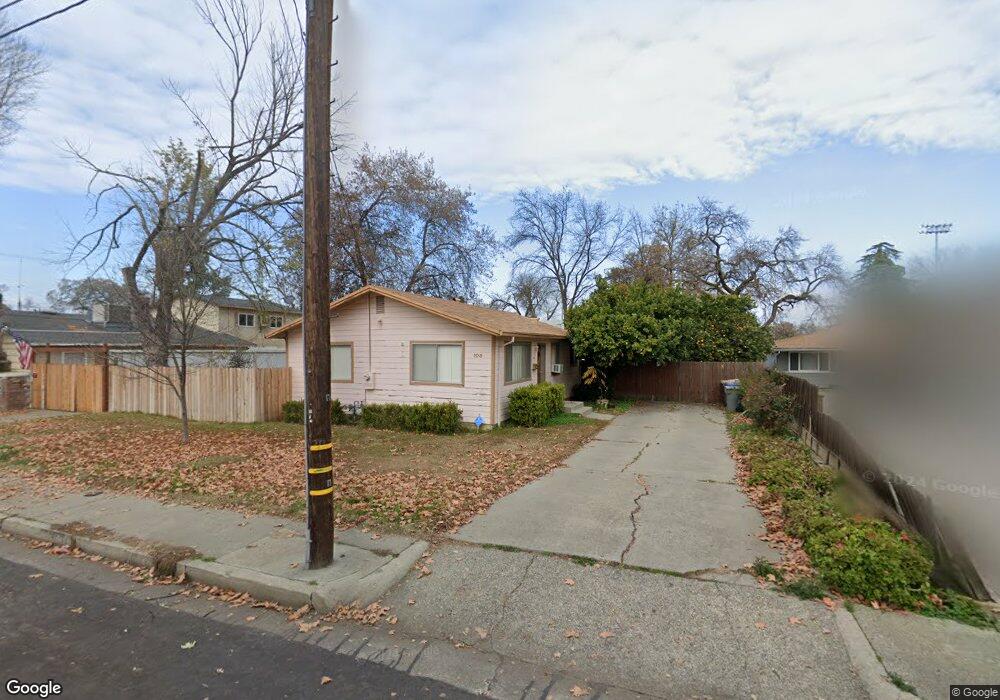
109 Clover St Woodland, CA 95695
Estimated Value: $329,000 - $408,000
2
Beds
1
Bath
936
Sq Ft
$398/Sq Ft
Est. Value
About This Home
This home is located at 109 Clover St, Woodland, CA 95695 and is currently estimated at $372,405, approximately $397 per square foot. 109 Clover St is a home located in Yolo County with nearby schools including Freeman Elementary School, Lee Middle School, and Woodland Senior High School.
Ownership History
Date
Name
Owned For
Owner Type
Purchase Details
Closed on
Dec 3, 2012
Sold by
Greb Daniel and Greb Rebecca
Bought by
Greb Daniel and Greb Rebecca
Current Estimated Value
Home Financials for this Owner
Home Financials are based on the most recent Mortgage that was taken out on this home.
Original Mortgage
$129,600
Outstanding Balance
$89,749
Interest Rate
3.36%
Mortgage Type
New Conventional
Estimated Equity
$282,656
Purchase Details
Closed on
Apr 30, 2010
Sold by
Baland Rebecca
Bought by
Baland Rebecca and Greb Daniel
Home Financials for this Owner
Home Financials are based on the most recent Mortgage that was taken out on this home.
Original Mortgage
$129,731
Interest Rate
5.25%
Mortgage Type
FHA
Purchase Details
Closed on
Apr 2, 2010
Sold by
Stadel Gerald R and Stadel Nina Joanne
Bought by
Greb Daniel and Baland Rebecca
Home Financials for this Owner
Home Financials are based on the most recent Mortgage that was taken out on this home.
Original Mortgage
$129,731
Interest Rate
5.25%
Mortgage Type
FHA
Create a Home Valuation Report for This Property
The Home Valuation Report is an in-depth analysis detailing your home's value as well as a comparison with similar homes in the area
Home Values in the Area
Average Home Value in this Area
Purchase History
| Date | Buyer | Sale Price | Title Company |
|---|---|---|---|
| Greb Daniel | -- | Fidelity Natl Title Co Of Ca | |
| Baland Rebecca | -- | None Available | |
| Greb Daniel | $150,000 | Fidelity Natl Title Co Of Ca |
Source: Public Records
Mortgage History
| Date | Status | Borrower | Loan Amount |
|---|---|---|---|
| Open | Greb Daniel | $129,600 | |
| Closed | Greb Daniel | $129,731 |
Source: Public Records
Tax History Compared to Growth
Tax History
| Year | Tax Paid | Tax Assessment Tax Assessment Total Assessment is a certain percentage of the fair market value that is determined by local assessors to be the total taxable value of land and additions on the property. | Land | Improvement |
|---|---|---|---|---|
| 2025 | $3,252 | $45,206 | $14,287 | $30,919 |
| 2023 | $3,252 | $43,452 | $13,733 | $29,719 |
| 2022 | $374 | $42,601 | $13,464 | $29,137 |
| 2021 | $367 | $41,766 | $13,200 | $28,566 |
| 2020 | $361 | $41,339 | $13,065 | $28,274 |
| 2019 | $353 | $40,529 | $12,809 | $27,720 |
| 2018 | $348 | $39,735 | $12,558 | $27,177 |
| 2017 | $339 | $38,957 | $12,312 | $26,645 |
| 2016 | $331 | $38,194 | $12,071 | $26,123 |
| 2015 | $318 | $37,621 | $11,890 | $25,731 |
| 2014 | $318 | $36,885 | $11,658 | $25,227 |
Source: Public Records
Map
Nearby Homes