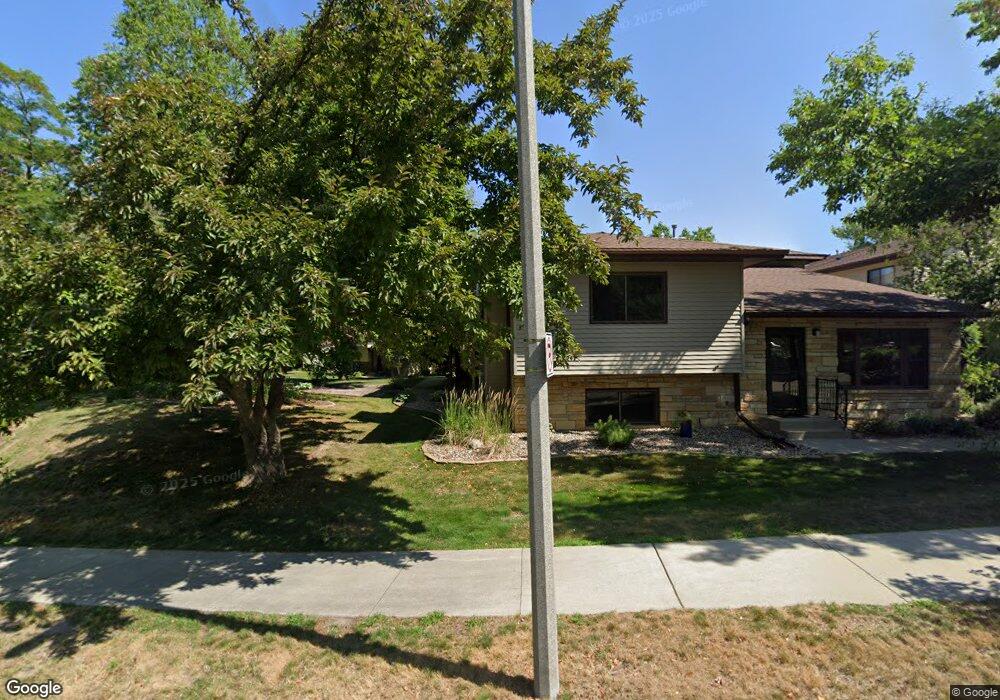
109 Conner Cir SW Rochester, MN 55902
Estimated Value: $211,628 - $232,000
2
Beds
1
Bath
924
Sq Ft
$239/Sq Ft
Est. Value
About This Home
This home is located at 109 Conner Cir SW, Rochester, MN 55902 and is currently estimated at $220,907, approximately $239 per square foot. 109 Conner Cir SW is a home located in Olmsted County with nearby schools including Bamber Valley Elementary School, John Adams Middle School, and Mayo Senior High School.
Ownership History
Date
Name
Owned For
Owner Type
Purchase Details
Closed on
Apr 22, 2024
Sold by
Olmsted Cnty Hsng & Redev Auth
Bought by
White Phillip J and White Sonya M
Current Estimated Value
Purchase Details
Closed on
Jan 29, 2024
Sold by
Bohlman Jenna
Bought by
White Philip J and White Sonya M
Purchase Details
Closed on
Sep 16, 2016
Sold by
Most Monique
Bought by
Bohlman Jenna
Home Financials for this Owner
Home Financials are based on the most recent Mortgage that was taken out on this home.
Original Mortgage
$109,400
Interest Rate
3.45%
Mortgage Type
New Conventional
Purchase Details
Closed on
Sep 17, 2008
Sold by
Berge Jennifer A
Bought by
Must Monique
Home Financials for this Owner
Home Financials are based on the most recent Mortgage that was taken out on this home.
Original Mortgage
$96,862
Interest Rate
6.52%
Mortgage Type
New Conventional
Create a Home Valuation Report for This Property
The Home Valuation Report is an in-depth analysis detailing your home's value as well as a comparison with similar homes in the area
Home Values in the Area
Average Home Value in this Area
Purchase History
| Date | Buyer | Sale Price | Title Company |
|---|---|---|---|
| White Phillip J | -- | -- | |
| White Philip J | $205,000 | Rochester Title | |
| Bohlman Jenna | $119,000 | Rochester Title & Escrow Co | |
| Must Monique | $107,624 | Rochester Title & Escrow |
Source: Public Records
Mortgage History
| Date | Status | Borrower | Loan Amount |
|---|---|---|---|
| Previous Owner | Bohlman Jenna | $109,400 | |
| Previous Owner | Must Monique | $96,862 |
Source: Public Records
Tax History Compared to Growth
Tax History
| Year | Tax Paid | Tax Assessment Tax Assessment Total Assessment is a certain percentage of the fair market value that is determined by local assessors to be the total taxable value of land and additions on the property. | Land | Improvement |
|---|---|---|---|---|
| 2024 | $2,576 | $204,800 | $35,000 | $169,800 |
| 2023 | $2,180 | $190,400 | $20,000 | $170,400 |
| 2022 | $1,982 | $174,700 | $20,000 | $154,700 |
| 2021 | $1,492 | $138,900 | $20,000 | $118,900 |
| 2020 | $1,496 | $130,000 | $20,000 | $110,000 |
| 2019 | $1,418 | $126,400 | $20,000 | $106,400 |
| 2018 | $1,199 | $121,500 | $20,000 | $101,500 |
| 2017 | $1,142 | $110,400 | $15,800 | $94,600 |
| 2016 | $1,152 | $73,700 | $11,400 | $62,300 |
| 2015 | $1,084 | $68,900 | $11,200 | $57,700 |
| 2014 | $1,052 | $70,000 | $11,200 | $58,800 |
| 2012 | -- | $69,900 | $11,235 | $58,665 |
Source: Public Records
Map
Nearby Homes
- 360 Wimbledon Hills Dr SW
- 2472 Gates Dr SW
- 3304 Lake St NW
- 822 Fox Pointe Ln SW
- 188 37th Ave NW
- 3415 Lake St NW
- 2773 Clover Place SW
- 810 Foxcroft Cir SW
- 3324 Fox Hollow Ln SW
- 700 Panorama Cir NW
- 327 20th Ave SW
- 1912 3rd St SW
- 2005 Hill Place SW
- 4119 Manor View Dr NW
- 468 Panorama Cir NW
- 785 Brandon Ln SW
- 121 18th Ave NW
- 3586 6th St NW
- 1729 W Center St
- 633 18th Ave SW
- 109 Conner Cir SW
- 110 Conner Cir SW
- 110 Conner Cir SW
- 110 Conner Cir SW
- 111 Conner Cir SW
- 112 Conner Cir SW
- 112 Conner Cir SW Unit 12
- 114 Conner Cir SW
- 115 Conner Cir SW
- 113 Conner Cir SW
- 115 Conner Cir SW
- 113 Conner Cir SW Unit 1A
- 116 Conner Cir SW
- 116 Conner Cir SW
- 106 Conner Cir SW
- 108 Conner Cir SW
- 107 Conner Cir SW
- 107 Conner Cir SW Unit 2
- 107 Conner Cir SW Unit 2
- 105 Conner Cir SW