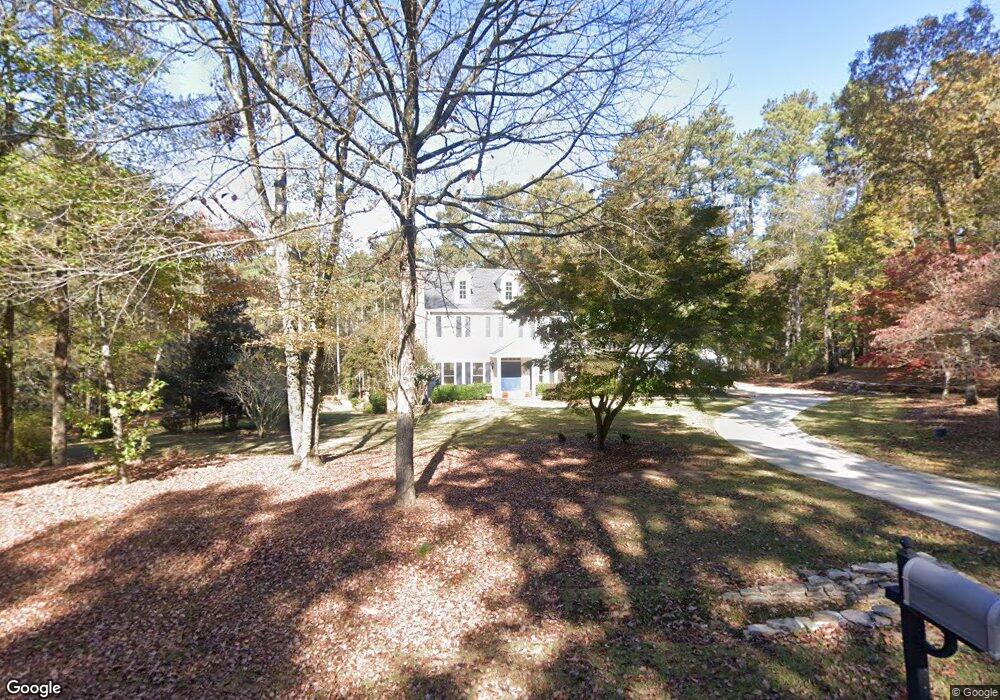
109 Deal Dr Lagrange, GA 30240
Estimated Value: $630,910 - $688,000
4
Beds
4
Baths
4,935
Sq Ft
$133/Sq Ft
Est. Value
About This Home
This home is located at 109 Deal Dr, Lagrange, GA 30240 and is currently estimated at $656,637, approximately $133 per square foot. 109 Deal Dr is a home located in Troup County with nearby schools including Hollis Hand Elementary School, Ethel W. Kight Elementary School, and Franklin Forest Elementary School.
Ownership History
Date
Name
Owned For
Owner Type
Purchase Details
Closed on
Feb 24, 2020
Sold by
Burckbuchler Scott A
Bought by
Burckbuchler Scott A and Burckbuchler Kerri L
Current Estimated Value
Home Financials for this Owner
Home Financials are based on the most recent Mortgage that was taken out on this home.
Original Mortgage
$421,650
Outstanding Balance
$374,136
Interest Rate
3.6%
Mortgage Type
New Conventional
Estimated Equity
$282,501
Purchase Details
Closed on
Sep 29, 2017
Sold by
Trizzino Peter
Bought by
Brown Jay W and Brown Christiana B
Home Financials for this Owner
Home Financials are based on the most recent Mortgage that was taken out on this home.
Original Mortgage
$300,000
Interest Rate
3.82%
Mortgage Type
New Conventional
Purchase Details
Closed on
Feb 9, 1994
Sold by
Karen Trizzino
Bought by
Trizzino Peter
Purchase Details
Closed on
Oct 16, 1980
Sold by
James S Foster
Bought by
Karen Trizzino
Purchase Details
Closed on
Dec 30, 1977
Sold by
Catherine Scott and Catherine Gordy
Bought by
James S Foster
Purchase Details
Closed on
Dec 17, 1976
Sold by
Daniel Lumber Co
Bought by
Catherine Scott and Catherine Gordy
Purchase Details
Closed on
Jan 1, 1975
Bought by
Daniel Lumber Co
Create a Home Valuation Report for This Property
The Home Valuation Report is an in-depth analysis detailing your home's value as well as a comparison with similar homes in the area
Home Values in the Area
Average Home Value in this Area
Purchase History
| Date | Buyer | Sale Price | Title Company |
|---|---|---|---|
| Burckbuchler Scott A | -- | -- | |
| Burckbuchler Scott A | $468,500 | -- | |
| Brown Jay W | $480,000 | -- | |
| Trizzino Peter | -- | -- | |
| Karen Trizzino | $35,000 | -- | |
| James S Foster | -- | -- | |
| Catherine Scott | -- | -- | |
| Daniel Lumber Co | -- | -- |
Source: Public Records
Mortgage History
| Date | Status | Borrower | Loan Amount |
|---|---|---|---|
| Open | Burckbuchler Scott A | $421,650 | |
| Previous Owner | Brown Jay W | $300,000 |
Source: Public Records
Tax History Compared to Growth
Tax History
| Year | Tax Paid | Tax Assessment Tax Assessment Total Assessment is a certain percentage of the fair market value that is determined by local assessors to be the total taxable value of land and additions on the property. | Land | Improvement |
|---|---|---|---|---|
| 2024 | $5,544 | $205,280 | $26,000 | $179,280 |
| 2023 | $5,434 | $199,240 | $20,000 | $179,240 |
| 2022 | $5,195 | $186,120 | $20,000 | $166,120 |
| 2021 | $5,490 | $182,040 | $18,400 | $163,640 |
| 2020 | $5,490 | $182,040 | $18,400 | $163,640 |
| 2019 | $5,250 | $174,080 | $18,400 | $155,680 |
| 2018 | $5,250 | $174,080 | $18,400 | $155,680 |
| 2017 | $3,843 | $134,400 | $18,400 | $116,000 |
| 2016 | $3,783 | $132,415 | $18,400 | $114,015 |
| 2015 | $3,790 | $132,415 | $18,400 | $114,015 |
| 2014 | $3,624 | $126,714 | $18,400 | $108,314 |
| 2013 | -- | $130,234 | $18,400 | $111,834 |
Source: Public Records
Map
Nearby Homes
- 116 Deal Dr
- 101 Deal Dr
- 114 Millridge Dr
- 654 Cameron Mill Rd
- 114 Morgan Dr
- 114-116 Morgan Dr
- 116 Morgan Dr
- 106 Highland Park
- 102 Willowcrest Way
- 0 Cameron Mill Rd Unit 10640133
- 603 Country Club Rd
- 641 Whitaker Rd
- 108 Spring Valley Dr
- 223 Pinehaven Dr
- 104 Spring Valley Dr
- 203 S Chilton Crescent
- 201 S Chilton Crescent
- 208 Highland Trail
- 117 Brookwood Dr
- 104 Sweetgum Dr