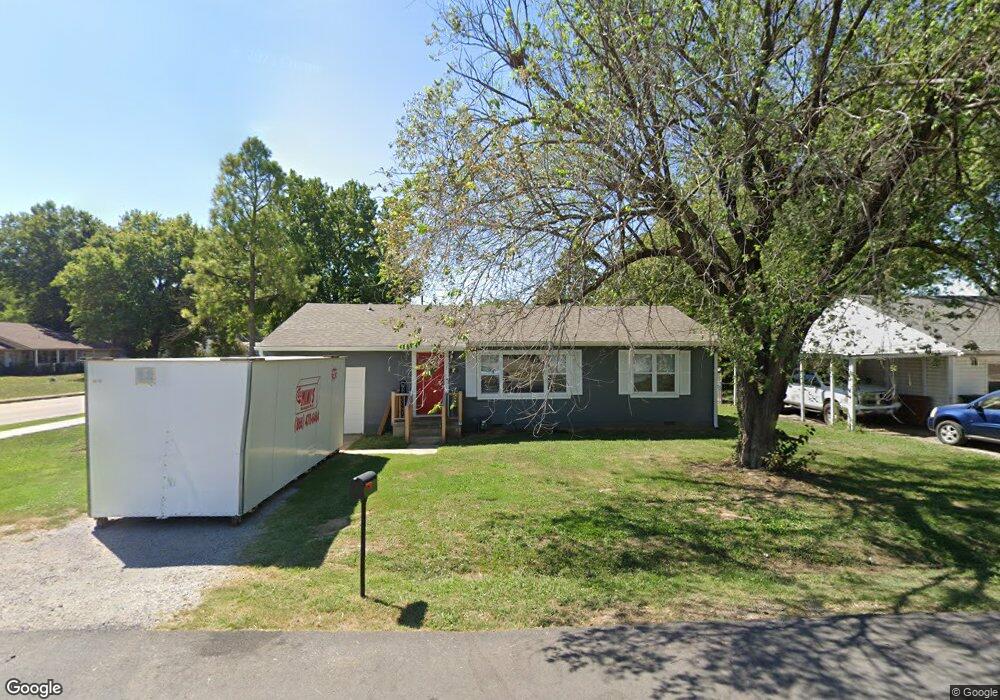
109 E 12th St Claremore, OK 74017
Estimated Value: $124,833 - $164,000
2
Beds
1
Bath
1,140
Sq Ft
$132/Sq Ft
Est. Value
About This Home
This home is located at 109 E 12th St, Claremore, OK 74017 and is currently estimated at $150,708, approximately $132 per square foot. 109 E 12th St is a home located in Rogers County with nearby schools including Claremont Elementary School, Will Rogers Junior High School, and Claremore High School.
Ownership History
Date
Name
Owned For
Owner Type
Purchase Details
Closed on
Oct 11, 2016
Sold by
Higgins Aubrey M and Higgins Kristopher
Bought by
Deien Angela
Current Estimated Value
Home Financials for this Owner
Home Financials are based on the most recent Mortgage that was taken out on this home.
Original Mortgage
$88,271
Outstanding Balance
$72,305
Interest Rate
4.25%
Mortgage Type
FHA
Estimated Equity
$78,403
Purchase Details
Closed on
Sep 11, 2007
Sold by
Wells Fargo Bank Na
Bought by
Bridges Aubrey M
Home Financials for this Owner
Home Financials are based on the most recent Mortgage that was taken out on this home.
Original Mortgage
$54,400
Interest Rate
6.37%
Mortgage Type
New Conventional
Purchase Details
Closed on
Mar 8, 2007
Purchase Details
Closed on
Feb 9, 2001
Sold by
Smith Pamela
Purchase Details
Closed on
Jul 23, 1996
Sold by
Cooksey Edgar Ray
Create a Home Valuation Report for This Property
The Home Valuation Report is an in-depth analysis detailing your home's value as well as a comparison with similar homes in the area
Home Values in the Area
Average Home Value in this Area
Purchase History
| Date | Buyer | Sale Price | Title Company |
|---|---|---|---|
| Deien Angela | $90,000 | Century Title Of Oklahoma | |
| Bridges Aubrey M | $68,000 | Oklahoma Reo Closing & Title | |
| -- | -- | None Available | |
| -- | $43,500 | -- | |
| -- | -- | -- |
Source: Public Records
Mortgage History
| Date | Status | Borrower | Loan Amount |
|---|---|---|---|
| Open | Deien Angela | $88,271 | |
| Previous Owner | Bridges Aubrey M | $54,400 |
Source: Public Records
Tax History
| Year | Tax Paid | Tax Assessment Tax Assessment Total Assessment is a certain percentage of the fair market value that is determined by local assessors to be the total taxable value of land and additions on the property. | Land | Improvement |
|---|---|---|---|---|
| 2025 | $791 | $8,561 | $2,276 | $6,285 |
| 2024 | $809 | $8,751 | $2,016 | $6,735 |
| 2023 | $809 | $10,441 | $2,016 | $8,425 |
| 2022 | $926 | $10,003 | $1,440 | $8,563 |
| 2021 | $903 | $10,229 | $1,440 | $8,789 |
| 2020 | $905 | $9,882 | $1,152 | $8,730 |
| 2019 | $874 | $9,441 | $1,152 | $8,289 |
| 2018 | $931 | $10,071 | $1,152 | $8,919 |
| 2017 | $917 | $9,987 | $1,152 | $8,835 |
| 2016 | $750 | $7,987 | $1,152 | $6,835 |
| 2015 | $705 | $7,607 | $1,152 | $6,455 |
| 2014 | -- | $7,477 | $1,152 | $6,325 |
Source: Public Records
Map
Nearby Homes
- 1317 N Mcfarland Place
- 1335 N Mcfarland Place
- 401 W Blue Starr Dr
- 104 W 7th St
- 509 N Weenonah Ave
- 1114 N Osage Ave
- 119 N Missouri Ave
- 314 W 7th St
- 2925 E Holly Rd
- 403 N Choctaw Ave
- 1411 N Choctaw Place
- 1402 N Dorothy Ave
- 1008 N Sioux Ave
- 817 E 11th St
- 821 E 11th St
- 1137 N Oklahoma Ave
- 0 N J M Davis Blvd
- 520 E 6th St
- 326 E 15th St
- 814 E Comet St
- 923 N Florence Ave
- 107 E 12th St
- 105 E 12th St
- 906 N Florence Ave
- 120 E 11th St
- 101 E 12th St
- 108 E 11th St
- 910 N Chickasaw Ave
- 204 E 11th St
- 115 E 12th Place
- 201 E 12th Place
- 1051 N Florence Ave
- 909 N Choctaw Ave
- 1010 N Florence Ave
- 905 N Choctaw Ave
- 1010 N Chickasaw Ave
- 1000 N Chickasaw Ave
- 203 E 12th Place
- null Clover Creek L 11
- 103 E 12th St
Your Personal Tour Guide
Ask me questions while you tour the home.