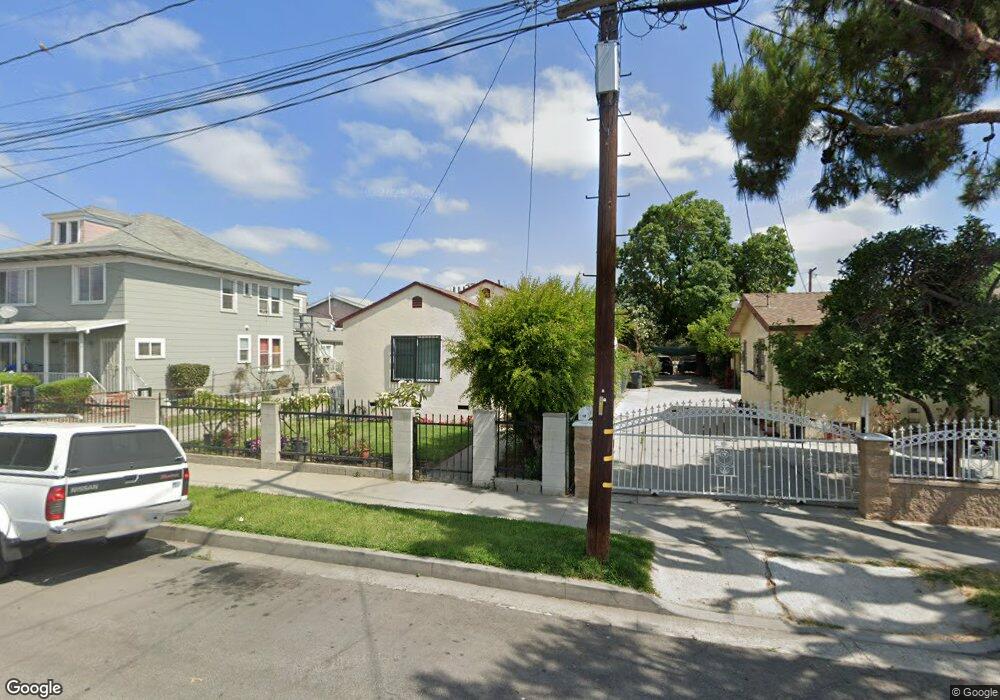
109 E Cocoa St Compton, CA 90220
Estimated Value: $617,000 - $771,000
5
Beds
2
Baths
1,910
Sq Ft
$372/Sq Ft
Est. Value
About This Home
This home is located at 109 E Cocoa St, Compton, CA 90220 and is currently estimated at $710,759, approximately $372 per square foot. 109 E Cocoa St is a home located in Los Angeles County with nearby schools including Dickison Elementary School, Benjamin O. Davis Middle School, and Compton High School.
Ownership History
Date
Name
Owned For
Owner Type
Purchase Details
Closed on
Oct 1, 2018
Sold by
Ruiz Gregorio and Ruiz Maria Teresa
Bought by
Ruiz Gregorio and Ruiz Maria Teresa
Current Estimated Value
Purchase Details
Closed on
Aug 12, 1997
Sold by
Diaz Angie and Diaz Felipe
Bought by
Ramirez Rosendo R and Robles Rosemary
Home Financials for this Owner
Home Financials are based on the most recent Mortgage that was taken out on this home.
Original Mortgage
$161,531
Interest Rate
7.3%
Mortgage Type
FHA
Purchase Details
Closed on
May 24, 1995
Sold by
Downey S & L Assn
Bought by
Diaz Angie and Diaz Felipe S
Home Financials for this Owner
Home Financials are based on the most recent Mortgage that was taken out on this home.
Original Mortgage
$126,000
Interest Rate
7.92%
Purchase Details
Closed on
Mar 8, 1995
Sold by
Castillo Clemente and Castillo Ofelia
Bought by
Downey S & L Assn
Create a Home Valuation Report for This Property
The Home Valuation Report is an in-depth analysis detailing your home's value as well as a comparison with similar homes in the area
Home Values in the Area
Average Home Value in this Area
Purchase History
| Date | Buyer | Sale Price | Title Company |
|---|---|---|---|
| Ruiz Gregorio | -- | None Available | |
| Ramirez Rosendo R | $165,000 | Old Republic Title Company | |
| Diaz Angie | $140,000 | Continental Lawyers Title Co | |
| Diaz Felipe S | -- | -- | |
| Downey S & L Assn | $13,062 | Continental Lawyers Title Co |
Source: Public Records
Mortgage History
| Date | Status | Borrower | Loan Amount |
|---|---|---|---|
| Previous Owner | Ramirez Rosendo R | $161,531 | |
| Previous Owner | Diaz Angie | $126,000 |
Source: Public Records
Tax History
| Year | Tax Paid | Tax Assessment Tax Assessment Total Assessment is a certain percentage of the fair market value that is determined by local assessors to be the total taxable value of land and additions on the property. | Land | Improvement |
|---|---|---|---|---|
| 2025 | $5,649 | $263,433 | $151,676 | $111,757 |
| 2024 | $5,649 | $258,268 | $148,702 | $109,566 |
| 2023 | $5,561 | $253,205 | $145,787 | $107,418 |
| 2022 | $4,634 | $248,241 | $142,929 | $105,312 |
| 2021 | $4,670 | $243,375 | $140,127 | $103,248 |
| 2020 | $4,592 | $240,881 | $138,691 | $102,190 |
| 2019 | $4,541 | $236,159 | $135,972 | $100,187 |
| 2018 | $4,341 | $231,529 | $133,306 | $98,223 |
| 2016 | $4,124 | $222,541 | $128,131 | $94,410 |
| 2015 | $3,948 | $219,199 | $126,207 | $92,992 |
| 2014 | $3,884 | $214,906 | $123,735 | $91,171 |
Source: Public Records
Map
Nearby Homes
- 125 E Alondra Blvd
- 114 E Alondra Blvd
- 105 W Cypress St
- 920 S Willowbrook Ave
- 512 S Willowbrook Ave
- 201 Racquet Club Dr
- 229 E Reeve St
- 165 Racquet Club Dr
- 112 E Caldwell St
- 319 W Almond St
- 426 W Laurel St
- 214 E Johnson St
- 427 W Laurel St
- 409 W Almond St
- 435 W Almond St
- 200 N Acacia Ave
- 301 W Magnolia St
- 338 W Magnolia St
- 212 S Santa fe Ave
- 524 W Laurel St
- 115 E Cocoa St
- 105 E Cocoa St
- 119 E Cocoa St
- 101 E Cocoa St
- 712 S Willowbrook Ave
- 708 S Willowbrook Ave
- 123 E Cocoa St
- 110 E Cypress St
- 114 E Cypress St
- 108 E Cocoa St
- 118 E Cypress St
- 106 E Cypress St
- 114 E Cocoa St
- 127 E Cocoa St Unit A
- 116 E Cocoa St
- 104 E Cypress St
- 122 E Cypress St
- 122 E Cocoa St
- 131 E Cocoa St
- 126 E Cypress St
Your Personal Tour Guide
Ask me questions while you tour the home.