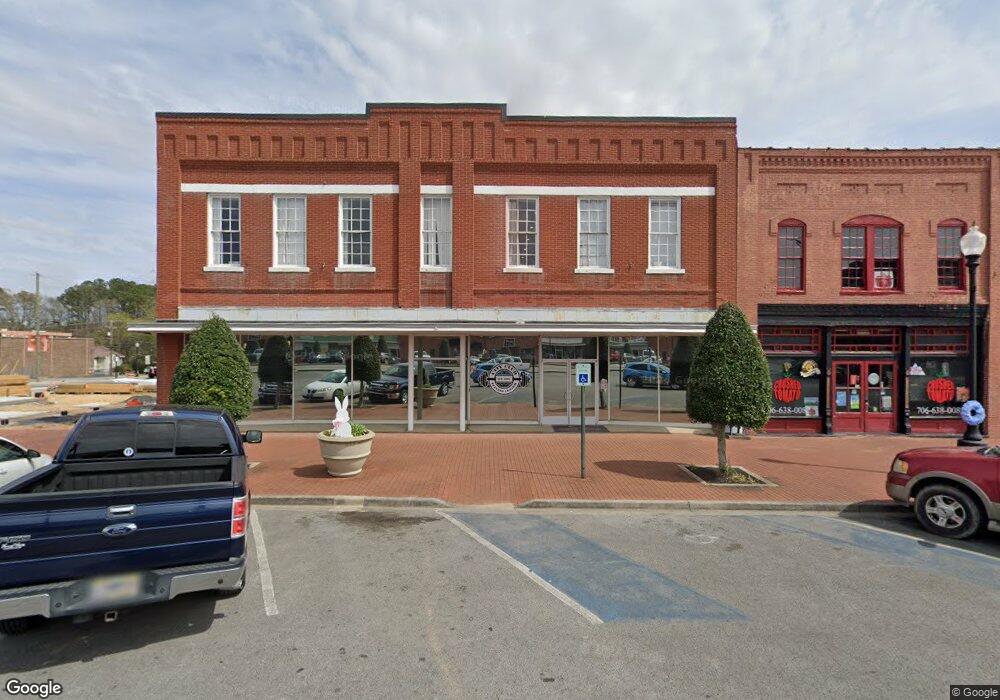
109 E Lafayette Square Lafayette, GA 30728
Estimated Value: $360,930
4
Beds
1
Bath
1,600
Sq Ft
$226/Sq Ft
Est. Value
About This Home
This home is located at 109 E Lafayette Square, Lafayette, GA 30728 and is currently estimated at $360,930, approximately $225 per square foot. 109 E Lafayette Square is a home located in Walker County with nearby schools including North Lafayette Elementary School, Lafayette Middle School, and Lafayette High School.
Ownership History
Date
Name
Owned For
Owner Type
Purchase Details
Closed on
Dec 11, 2023
Sold by
Brood Box Llc
Bought by
Downtown Development Authority Of Lafaye
Current Estimated Value
Purchase Details
Closed on
Oct 31, 2019
Sold by
Dendy Heather
Bought by
Brood Box Llc
Home Financials for this Owner
Home Financials are based on the most recent Mortgage that was taken out on this home.
Original Mortgage
$153,980
Interest Rate
3.65%
Mortgage Type
New Conventional
Purchase Details
Closed on
Feb 27, 2003
Sold by
Gottlieb David Sherin R
Bought by
Dendy William and Heather Dendy
Purchase Details
Closed on
Jul 31, 1998
Sold by
Cherner Sherry and Stan Lapidus
Bought by
Gottlieb David Sherin R
Purchase Details
Closed on
Aug 30, 1978
Sold by
James H Cole J and James H Cole J
Bought by
Cherner Sherry and Stan Lapidus
Purchase Details
Closed on
Jan 1, 1972
Bought by
James H Cole J and James H Cole J
Create a Home Valuation Report for This Property
The Home Valuation Report is an in-depth analysis detailing your home's value as well as a comparison with similar homes in the area
Home Values in the Area
Average Home Value in this Area
Purchase History
| Date | Buyer | Sale Price | Title Company |
|---|---|---|---|
| Downtown Development Authority Of Lafaye | $325,000 | -- | |
| Brood Box Llc | $150,000 | -- | |
| Dendy William | $170,000 | -- | |
| Gottlieb David Sherin R | $185,000 | -- | |
| Cherner Sherry | $58,000 | -- | |
| James H Cole J | -- | -- |
Source: Public Records
Mortgage History
| Date | Status | Borrower | Loan Amount |
|---|---|---|---|
| Previous Owner | Brood Box Llc | $282,021 | |
| Previous Owner | Brood Box Llc | $153,980 | |
| Previous Owner | Dendy William | $300,000 |
Source: Public Records
Tax History Compared to Growth
Tax History
| Year | Tax Paid | Tax Assessment Tax Assessment Total Assessment is a certain percentage of the fair market value that is determined by local assessors to be the total taxable value of land and additions on the property. | Land | Improvement |
|---|---|---|---|---|
| 2024 | -- | $285,195 | $19,845 | $265,350 |
| 2023 | $3,598 | $146,562 | $13,014 | $133,548 |
| 2022 | $2,378 | $90,318 | $13,014 | $77,304 |
| 2021 | $2,652 | $90,318 | $13,014 | $77,304 |
| 2020 | $1,841 | $123,210 | $13,014 | $110,196 |
| 2019 | $3,782 | $123,210 | $13,014 | $110,196 |
| 2018 | $3,666 | $123,210 | $13,014 | $110,196 |
| 2017 | $4,097 | $123,210 | $13,014 | $110,196 |
| 2016 | $3,397 | $123,210 | $13,014 | $110,196 |
| 2015 | $2,316 | $80,015 | $12,924 | $67,091 |
| 2014 | $2,229 | $80,015 | $12,924 | $67,091 |
| 2013 | -- | $80,015 | $12,924 | $67,091 |
Source: Public Records
Map
Nearby Homes
- 0 Farris St Unit 1512317
- 0 Farris St
- 204 E Villanow St
- 208 E Villanow St
- 302 S Main St
- Lot 4 Oak St
- 204 W Main St
- 502 S Main St
- 302 Brookwood Ln
- 311 N Duke St
- 0 Georgia 136
- 133 N Chattanooga St
- 113 Ann St
- 201 Warthen St
- 209 Meadowbrook Ln
- 607 N Chattanooga St
- 506 Daugherty St
- 301 Cedar St
- 414 Magnolia St
- 316 Chestnut St
- 109 E Lafayette Square
- 109 E Lafayette Square
- 115 E Lafayette Square
- 101 E Lafayette Square
- 0 Quail Run Unit 12 7461077
- 0 Quail Run Unit 11 7461042
- 0 Quail Run Unit 9 7460906
- 0 Quail Run Unit 10 7460826
- 0 Quail Run Unit 13 7460803
- 0 Quail Run
- 0 Quail Run Unit 8730395
- 0 Quail Run Unit 8948458
- 0 Quail Run Unit 8948790
- 0 Quail Run Unit 9015671
- 0 Quail Run Unit 9055004
- 0 Quail Run Unit 9
- 0 Quail Run Unit 12
- 0 Quail Run Unit 11
- 0 Quail Run Unit 10
- 0 Quail Run Unit 8739502