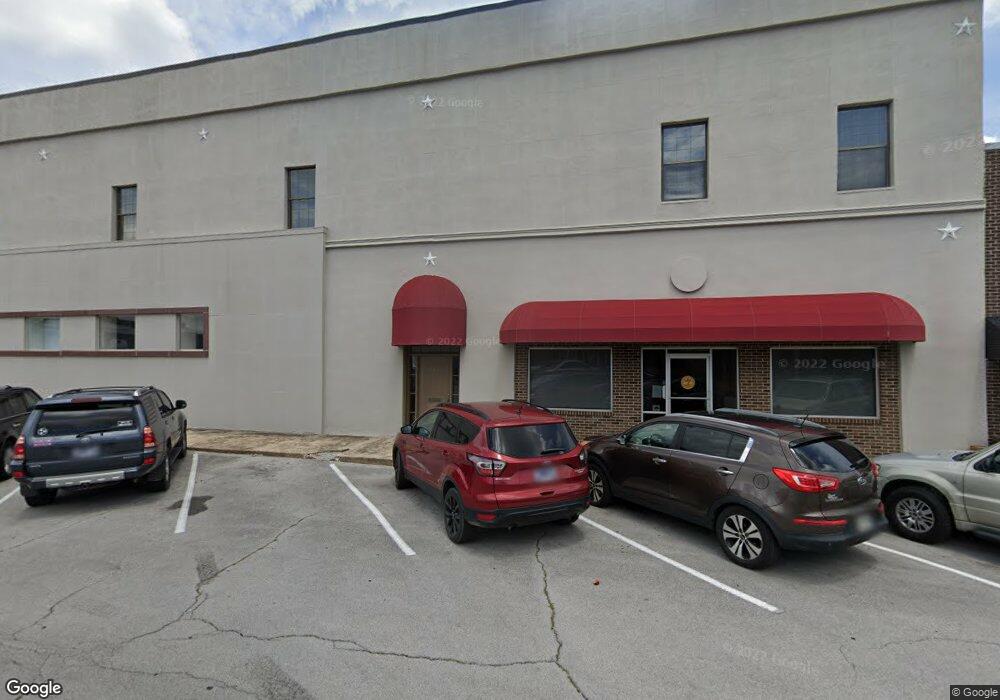
109 E Main St Manchester, TN 37355
Estimated Value: $254,194 - $282,000
Studio
1
Bath
1,904
Sq Ft
$143/Sq Ft
Est. Value
About This Home
This home is located at 109 E Main St, Manchester, TN 37355 and is currently estimated at $271,731, approximately $142 per square foot. 109 E Main St is a home located in Coffee County with nearby schools including Westwood Middle School and Temple Baptist Christian School.
Ownership History
Date
Name
Owned For
Owner Type
Purchase Details
Closed on
Dec 14, 2023
Sold by
Rogers J Stanley J and Rogers Pat C
Bought by
Rolen Personnel Llc
Current Estimated Value
Home Financials for this Owner
Home Financials are based on the most recent Mortgage that was taken out on this home.
Original Mortgage
$700,000
Outstanding Balance
$463,092
Interest Rate
7.76%
Mortgage Type
New Conventional
Estimated Equity
-$191,361
Purchase Details
Closed on
Apr 3, 2018
Sold by
Duncan Christina Henley
Bought by
Rogers Stanley and Rogers Pat C
Create a Home Valuation Report for This Property
The Home Valuation Report is an in-depth analysis detailing your home's value as well as a comparison with similar homes in the area
Home Values in the Area
Average Home Value in this Area
Purchase History
| Date | Buyer | Sale Price | Title Company |
|---|---|---|---|
| Rolen Personnel Llc | $250,000 | None Listed On Document | |
| Rogers Stanley | $12,449 | None Available |
Source: Public Records
Mortgage History
| Date | Status | Borrower | Loan Amount |
|---|---|---|---|
| Open | Rolen Personnel Llc | $700,000 |
Source: Public Records
Tax History
| Year | Tax Paid | Tax Assessment Tax Assessment Total Assessment is a certain percentage of the fair market value that is determined by local assessors to be the total taxable value of land and additions on the property. | Land | Improvement |
|---|---|---|---|---|
| 2025 | $1,554 | $36,880 | $4,000 | $32,880 |
| 2024 | $1,554 | $36,880 | $4,000 | $32,880 |
| 2023 | $1,554 | $36,880 | $0 | $0 |
| 2022 | $1,338 | $36,880 | $4,000 | $32,880 |
| 2021 | $612 | $13,350 | $2,500 | $10,850 |
| 2020 | $612 | $13,350 | $2,500 | $10,850 |
| 2019 | $612 | $13,350 | $2,500 | $10,850 |
| 2018 | $612 | $13,350 | $2,500 | $10,850 |
| 2017 | $589 | $11,225 | $2,500 | $8,725 |
| 2016 | $589 | $11,225 | $2,500 | $8,725 |
| 2015 | $589 | $11,225 | $2,500 | $8,725 |
| 2014 | $589 | $11,230 | $0 | $0 |
Source: Public Records
Map
Nearby Homes
- 412 E Harp St
- 612 Maple St
- 317 W Short St
- 321 W Short St
- 611 Park Ave
- 0 W Coffee St
- 401 Hillcrest Rd
- 210 Rigney Dr
- 902 Sycamore Dr
- 100 Philips Dr
- 69 Laurel View St
- 57 Laurel View St
- 27 Laurel View St
- 37 Laurel View St
- 1011 S Spring St
- 1006 Remington Place
- 1301 Sycamore Dr
- 1005 Keylon St
- 793 Old Bushy Branch Rd
- 0 Woodbury Hwy Unit RTC3066567
- 100 N Spring St
- 108 N Spring St
- 108 N Spring St
- 106 E Main St
- 104 E Main St
- 112 E Main St
- 118 N Spring St
- 101 W Main St
- 109 Bluegrass Rd
- 111 W Main St
- 113 W Main St Unit 111
- 113 W Main St
- 119 S Spring St
- 133 E Main St
- 117 W Main St
- 115 N Woodland St
- 200 N Spring St
- 108 W Mclean St
- 117 E Fort St
- 104 W Fort St
Your Personal Tour Guide
Ask me questions while you tour the home.