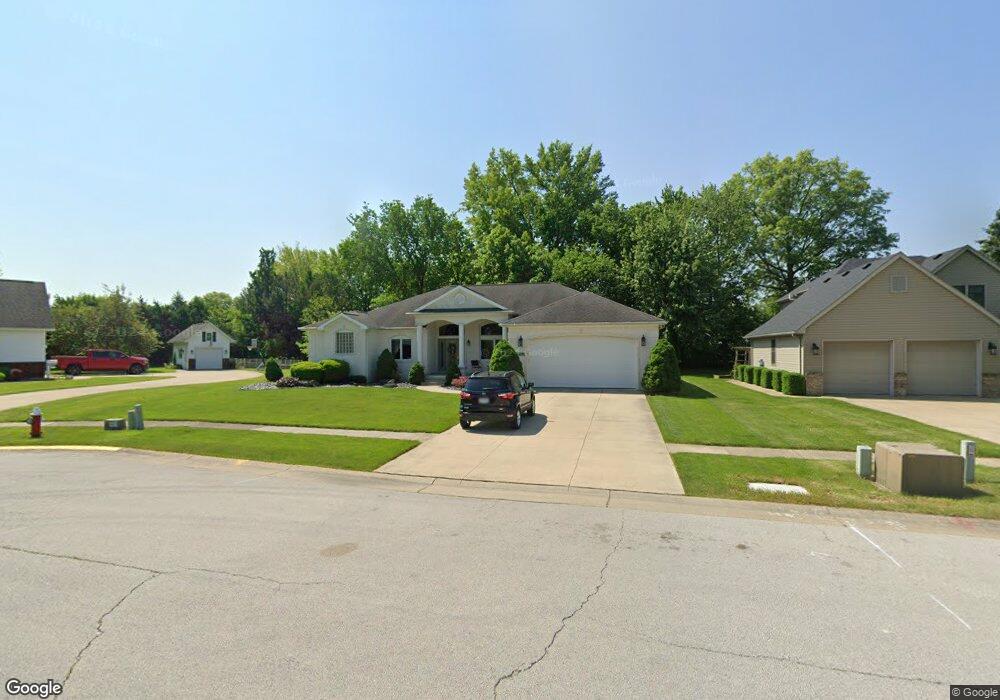
109 E Oak St Oak Harbor, OH 43449
Estimated Value: $353,326 - $500,000
3
Beds
2
Baths
2,560
Sq Ft
$158/Sq Ft
Est. Value
About This Home
This home is located at 109 E Oak St, Oak Harbor, OH 43449 and is currently estimated at $403,332, approximately $157 per square foot. 109 E Oak St is a home located in Ottawa County with nearby schools including Oak Harbor High School, St. Boniface Catholic School and Preschool, and Ottawa County Christian Academy.
Ownership History
Date
Name
Owned For
Owner Type
Purchase Details
Closed on
Aug 14, 2020
Sold by
Mulligan Mark E and Jaqueline F Mulligan Trusts
Bought by
Slagle Douglas A and Slagle Lori A
Current Estimated Value
Home Financials for this Owner
Home Financials are based on the most recent Mortgage that was taken out on this home.
Original Mortgage
$120,000
Outstanding Balance
$95,946
Interest Rate
3%
Mortgage Type
New Conventional
Estimated Equity
$307,386
Purchase Details
Closed on
Aug 23, 2012
Sold by
Mulligan Michael L and Mulligan Anne F
Bought by
Mullingan Jacqueline F and Jacqueline F Mulligan Trust
Purchase Details
Closed on
Oct 8, 2009
Sold by
Mulligan Jacqueline F
Bought by
Mulligan Michael L and Mulligan Anne E
Home Financials for this Owner
Home Financials are based on the most recent Mortgage that was taken out on this home.
Original Mortgage
$290,000
Interest Rate
5.19%
Mortgage Type
Seller Take Back
Create a Home Valuation Report for This Property
The Home Valuation Report is an in-depth analysis detailing your home's value as well as a comparison with similar homes in the area
Home Values in the Area
Average Home Value in this Area
Purchase History
| Date | Buyer | Sale Price | Title Company |
|---|---|---|---|
| Slagle Douglas A | $290,000 | None Available | |
| Mullingan Jacqueline F | -- | Attorney | |
| Mulligan Michael L | $290,000 | Attorney |
Source: Public Records
Mortgage History
| Date | Status | Borrower | Loan Amount |
|---|---|---|---|
| Open | Slagle Douglas A | $120,000 | |
| Previous Owner | Mulligan Michael L | $290,000 |
Source: Public Records
Tax History
| Year | Tax Paid | Tax Assessment Tax Assessment Total Assessment is a certain percentage of the fair market value that is determined by local assessors to be the total taxable value of land and additions on the property. | Land | Improvement |
|---|---|---|---|---|
| 2024 | $4,753 | $108,542 | $17,416 | $91,126 |
| 2023 | $4,789 | $93,828 | $17,423 | $76,405 |
| 2022 | $4,578 | $93,828 | $17,423 | $76,405 |
| 2021 | $4,609 | $93,830 | $17,420 | $76,410 |
| 2020 | $4,462 | $91,560 | $15,150 | $76,410 |
| 2019 | $4,348 | $91,560 | $15,150 | $76,410 |
| 2018 | $4,033 | $91,560 | $15,150 | $76,410 |
| 2017 | $3,641 | $86,870 | $15,150 | $71,720 |
| 2016 | $3,647 | $86,870 | $15,150 | $71,720 |
| 2015 | $3,396 | $86,870 | $15,150 | $71,720 |
| 2014 | $3,234 | $86,870 | $15,150 | $71,720 |
| 2013 | $3,234 | $86,870 | $15,150 | $71,720 |
Source: Public Records
Map
Nearby Homes
- 157 E Ottawa St
- 306 E Main St
- 0.0 W State Route 163 Unit 2
- 214 N Church St
- 0 W State Route 163
- 328 E Water St
- 137 Prospect St
- 165 Finke Rd
- 427 N Locust St
- 121 Bank St
- 435 Burdine Dr
- 210 S Gordon Dr
- 318 Country Meadows Dr
- 162 Oak Ridge Dr
- 1276 S Grandview Dr
- 12235 W State Route 105
- 8845 W State Route 163
- 1 S Mud Creek Rd
- 8685 W Oak Harbor Southeast Rd
- 3131 S State Route 19
Your Personal Tour Guide
Ask me questions while you tour the home.