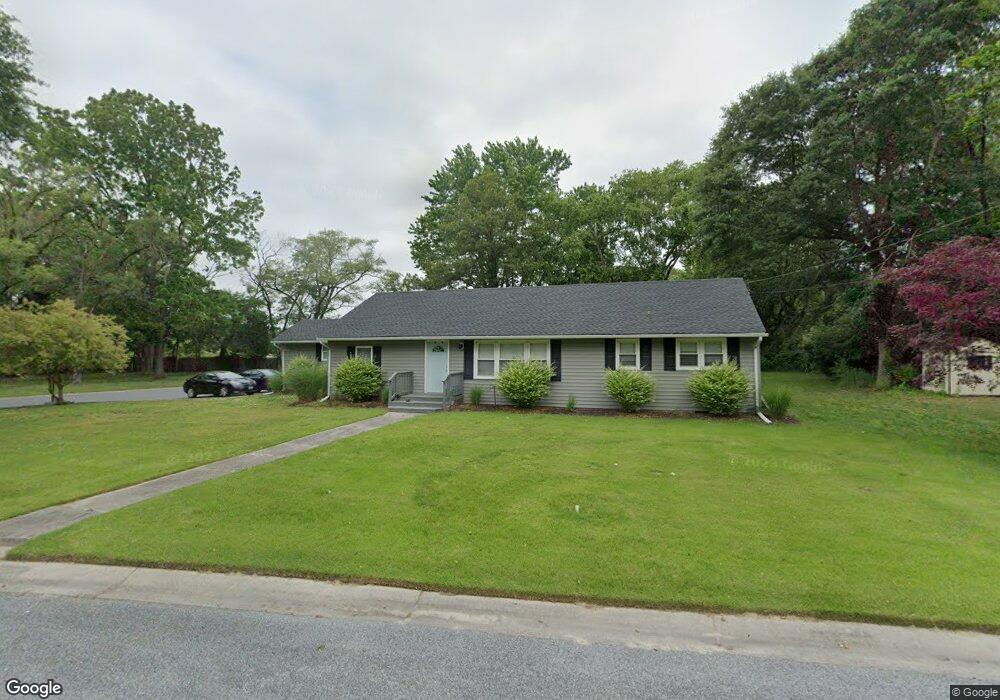
109 Francis Dr Salisbury, MD 21804
South Salisbury NeighborhoodEstimated Value: $209,059 - $239,000
--
Bed
1
Bath
1,212
Sq Ft
$184/Sq Ft
Est. Value
About This Home
This home is located at 109 Francis Dr, Salisbury, MD 21804 and is currently estimated at $223,265, approximately $184 per square foot. 109 Francis Dr is a home located in Wicomico County with nearby schools including Prince Street Elementary School, Bennett Middle School, and James M. Bennett High School.
Ownership History
Date
Name
Owned For
Owner Type
Purchase Details
Closed on
Dec 28, 2006
Sold by
Godfrey R R and Godfrey Olph B
Bought by
Newquist Sharon
Current Estimated Value
Home Financials for this Owner
Home Financials are based on the most recent Mortgage that was taken out on this home.
Original Mortgage
$145,059
Outstanding Balance
$99,083
Interest Rate
8.95%
Mortgage Type
Purchase Money Mortgage
Estimated Equity
$124,182
Purchase Details
Closed on
Dec 6, 2006
Sold by
Godfrey R R and Godfrey Olph B
Bought by
Newquist Sharon
Home Financials for this Owner
Home Financials are based on the most recent Mortgage that was taken out on this home.
Original Mortgage
$145,059
Outstanding Balance
$99,083
Interest Rate
8.95%
Mortgage Type
Purchase Money Mortgage
Estimated Equity
$124,182
Purchase Details
Closed on
May 31, 1978
Sold by
Wilkinson Wilkinson F and Wilkinson Elizabeth K
Bought by
Godfrey Randolph B and Godfrey Ola M
Create a Home Valuation Report for This Property
The Home Valuation Report is an in-depth analysis detailing your home's value as well as a comparison with similar homes in the area
Home Values in the Area
Average Home Value in this Area
Purchase History
| Date | Buyer | Sale Price | Title Company |
|---|---|---|---|
| Newquist Sharon | $152,694 | -- | |
| Newquist Sharon | $152,694 | -- | |
| Godfrey Randolph B | $39,000 | -- |
Source: Public Records
Mortgage History
| Date | Status | Borrower | Loan Amount |
|---|---|---|---|
| Open | Newquist Sharon | $145,059 | |
| Closed | Newquist Sharon | $145,059 |
Source: Public Records
Tax History Compared to Growth
Tax History
| Year | Tax Paid | Tax Assessment Tax Assessment Total Assessment is a certain percentage of the fair market value that is determined by local assessors to be the total taxable value of land and additions on the property. | Land | Improvement |
|---|---|---|---|---|
| 2025 | $1,290 | $142,733 | $0 | $0 |
| 2024 | $1,290 | $128,300 | $29,900 | $98,400 |
| 2023 | $1,278 | $123,233 | $0 | $0 |
| 2022 | $1,264 | $118,167 | $0 | $0 |
| 2021 | $1,216 | $113,100 | $29,900 | $83,200 |
| 2020 | $1,203 | $110,800 | $0 | $0 |
| 2019 | $1,196 | $108,500 | $0 | $0 |
| 2018 | $1,177 | $106,200 | $29,900 | $76,300 |
| 2017 | $1,108 | $99,633 | $0 | $0 |
| 2016 | $1,150 | $93,067 | $0 | $0 |
| 2015 | $1,150 | $86,500 | $0 | $0 |
| 2014 | $1,150 | $86,500 | $0 | $0 |
Source: Public Records
Map
Nearby Homes
- 1165 S Division St
- 1207 Nimitz Ct
- 152 Onley Rd
- 203 Shannon Ct
- 1504 Lilac Dr
- 1315 Aspen Dr
- 104 Coulbourn Dr
- 116 Coulbourn Dr
- 202 Donegal Ct
- 310 Princeton Ave
- 138 Coulbourn Dr
- 505 E College Ave
- 225 Canal Park Dr Unit 15
- 227 Canal Park Dr Unit 301
- 231 Canal Park Dr Unit A200
- 413 Pine Bluff Rd
- 915 Green Mor Ave
- 224 Canal Park Dr Unit 101
- 228 Canal Park Dr Unit G7
- 228 Canal Park Dr Unit G208