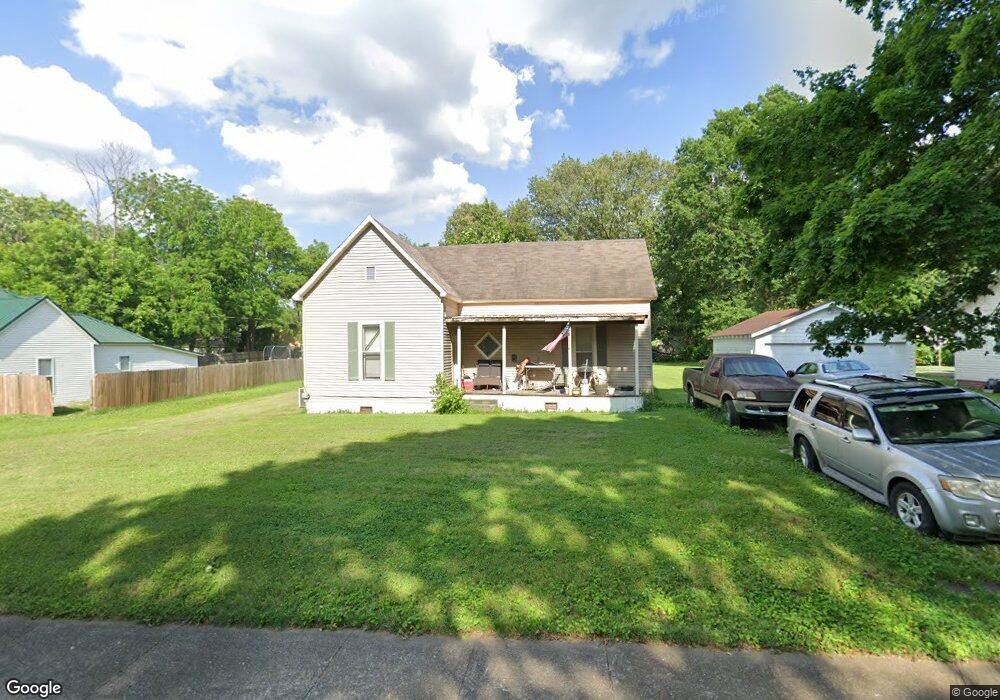
109 Fulton St Martin, TN 38237
Estimated Value: $74,796 - $113,000
2
Beds
1
Bath
1,446
Sq Ft
$60/Sq Ft
Est. Value
About This Home
This home is located at 109 Fulton St, Martin, TN 38237 and is currently estimated at $86,949, approximately $60 per square foot. 109 Fulton St is a home located in Weakley County with nearby schools including Central Christian Academy and Unity Christian School.
Ownership History
Date
Name
Owned For
Owner Type
Purchase Details
Closed on
Jan 27, 2017
Sold by
Garner Greg
Bought by
Barron Glynn E and Barron Alice F
Current Estimated Value
Purchase Details
Closed on
Aug 29, 2007
Bought by
Garner Greg Chloe
Purchase Details
Closed on
Feb 13, 1996
Sold by
Telecommunications Co Of T
Bought by
Barron Glynn E and Barron Alice F
Purchase Details
Closed on
Feb 13, 1995
Bought by
Barron Glynn E and Barron Alice F
Purchase Details
Closed on
Jul 2, 1993
Bought by
Williamson Joseph C
Purchase Details
Closed on
Dec 18, 1992
Bought by
Cooper Billie G
Create a Home Valuation Report for This Property
The Home Valuation Report is an in-depth analysis detailing your home's value as well as a comparison with similar homes in the area
Home Values in the Area
Average Home Value in this Area
Purchase History
| Date | Buyer | Sale Price | Title Company |
|---|---|---|---|
| Barron Glynn E | $62,500 | -- | |
| Garner Greg Chloe | $280,000 | -- | |
| Barron Glynn E | $8,000 | -- | |
| Barron Glynn E | $8,000 | -- | |
| Williamson Joseph C | $8,000 | -- | |
| Cooper Billie G | $5,000 | -- |
Source: Public Records
Tax History Compared to Growth
Tax History
| Year | Tax Paid | Tax Assessment Tax Assessment Total Assessment is a certain percentage of the fair market value that is determined by local assessors to be the total taxable value of land and additions on the property. | Land | Improvement |
|---|---|---|---|---|
| 2024 | -- | $14,975 | $2,025 | $12,950 |
| 2023 | $494 | $14,975 | $2,025 | $12,950 |
| 2022 | $461 | $12,350 | $1,950 | $10,400 |
| 2021 | $461 | $12,350 | $1,950 | $10,400 |
| 2020 | $461 | $12,350 | $1,950 | $10,400 |
| 2019 | $417 | $12,350 | $1,950 | $10,400 |
| 2018 | $373 | $11,050 | $1,950 | $9,100 |
| 2017 | $329 | $9,075 | $1,625 | $7,450 |
| 2016 | $329 | $9,075 | $0 | $0 |
| 2015 | $330 | $9,087 | $0 | $0 |
| 2014 | $330 | $9,087 | $0 | $0 |
Source: Public Records
Map
Nearby Homes